Machine learning (ML) techniques have been applied in diverse manners to combat the COVID-19 pandemic. Predictive ML models have been constructed, for example, for both diagnostic and prognostic objectives, utilizing varying data modalities such as textual, visual, and structured formats. Because of the distinct characteristics of this disease and its temporal transformation, a comprehensive understanding of the central elements driving the clinical trajectory of COVID-19 in individual patients remains incomplete. Throughout all phases of this study, a medical specialist was actively engaged via a human-in-the-loop framework. This collaborative element represents a vital yet frequently overlooked component of the ML and knowledge extraction (KE) workflow. Our findings indicate that explainable artificial intelligence (XAI) can offer substantial reinforcement to this dimension of ML and KE. This investigation centered on employing ML for knowledge extraction across two distinct operational scenarios. In the initial scenario, we sought to determine if integrating data regarding the dominant COVID-19 variant affects the predictive performance of the ML models. In the subsequent scenario, we concentrated on prognostic classification models designed to predict a patient's requirement for intensive care unit admission, integrating various XAI methodologies. We implemented nine distinct ML techniques, specifically XGBoost, CatBoost, LightGBM, logistic regression, Naive Bayes, random forest, SGD, SVM-linear, and SVM-RBF. The predictive quality of these models was evaluated using precision, accuracy, and AUC metrics. Following this evaluation, knowledge extraction was performed on the highest-performing models through two discrete pathways: (a) automated feature extraction using forward stepwise selection (FSS); and (b) the identification of attributes and their interactions using model explainability tools. Both sets of features were evaluated against a baseline configuration of attributes selected a priori by medical professionals using domain expertise. Our empirical tests demonstrated that incorporating data on the prevailing COVID-19 variant did not alter the performance of the generated ML models. Furthermore, the results indicated that human medical experts displayed significantly higher precision in identifying meaningful attributes compared to the automated FSS approach. Explainability tools identified nearly identical sets of attributes as the medical expert, while additionally uncovering noteworthy attribute interactions that the specialist subsequently evaluated from a clinical perspective. The outcomes of this investigation and their broader implications are examined.
COVID-19, alternatively designated as the coronavirus disease, has surfaced as a primary subject of global discourse, instigating constraints on societal movement, educational closures, and business shutdowns that have profoundly disrupted the daily experiences of millions worldwide. Despite the considerable duration that has transpired since the initial emergence of the pandemic, the subject remains highly relevant across multiple academic disciplines, including medicine, epidemiology, economics, psychology, and sociology. COVID-19 has established itself as a critical healthcare challenge impacting millions internationally, making it one of the most prominent health dangers of the modern era. Empirical evidence indicates that certain populations exhibit greater vulnerability to coronavirus contraction and face an elevated risk of experiencing severe clinical outcomes. Similarly, certain demographics appeared to be more severely affected by distinct variants of COVID-19, whereas other groups demonstrated entirely contrasting trajectories. Additionally, preexisting comorbidities and alternative variables can alter the progression of the illness, though they are frequently overlooked during initial clinical assessments. Driven by these observations, this study aims to evaluate the risk factors governing the clinical evolution of the disease utilizing machine learning methodologies, while concurrently examining data regarding the prevailing COVID-19 variant to ascertain its influence on the generated ML frameworks. Throughout every phase of this research, medical professionals were deeply integrated into the workflow, which represents an essential element of the ML and knowledge extraction lifecycle that is regularly omitted in comparable investigative literature.
Our initial effort focuses on reviewing the current state of literature, where we critique the machine learning methodologies implemented in open-access publications and compare their predictive capabilities. We also evaluate the specific risk factors documented in prior literature, summarizing the variables that most strongly dictate the severity of the disease. We detail the methodology and empirical investigations conducted on open-access COVID-19 patient data using the CRISP-DM framework. We first test the consequences of incorporating information about the dominant viral variant on individual model performance. Secondly, we examine classification frameworks designed to forecast whether an individual patient possesses a vulnerability requiring admission to the Intensive Care Unit (ICU). The emphasis in this section is placed on knowledge extraction regarding the primary elements that dictate a patient's COVID-19 prognosis. Furthermore, we leverage two distinct ML explainability techniques—SHAP and LIME—to assess local and global interactions among the most critical features identified through these tools. We subsequently analyze all developed models and synthesize their collective outcomes. In the concluding section, we consolidate the primary insights, address the formulated Research Questions (RQ), examine the broader consequences of the findings, and outline prospective avenues for future research.
The primary contributions of this research include empirical validation showing that information regarding the specific COVID-19 variant does not alter the predictive performance of the resulting ML frameworks when such data is supplied merely at the regional level of the dominant viral strain. Additionally, we demonstrate that the involvement of medical specialists is indispensable for the correct identification of key attributes and the subsequent analysis of their clinical significance under a human-in-the-loop paradigm. Lastly, we show that explainability tools successfully isolate nearly identical attributes as human experts while revealing compelling feature interactions that, when paired with clinical knowledge, offer valuable healthcare insights.
Coronavirus disease 2019 (COVID-19) represents a highly transmissible viral infection brought about by the SARS-CoV-2 (severe acute respiratory syndrome—coronavirus 2) pathogen. The clinical severity of the infection is determined not only by the viral properties themselves but also by the biological characteristics of the host organism. Uncovering the specific determinants that lead to a severe clinical trajectory remains highly critical [1], primarily because it facilitates the prioritized distribution of medical resources to high-risk cohorts to mitigate mortality rates.
Diverse statistical strategies along with ML algorithms are deployed to isolate these risk factors. The most commonly implemented ML models and their predictive capabilities are reviewed. Apart from applying ML techniques for forecasting, they are similarly utilized for knowledge extraction to uncover the primary elements dictating the course of COVID-19. We evaluate relevant publications from this knowledge extraction viewpoint .
The most prevalent machine learning techniques used in this domain encompass logistic regression frameworks, random forest architectures, and decision tree models [2]. Furthermore, the Cox proportional hazards regression technique [3] and multiple gradient boosting frameworks [4] are frequently encountered. These prognostic frameworks are typically deployed to categorize patient groups according to their anticipated survival probability or disease severity, as well as to uncover essential clinical risk factors.
Compelling investigations have been performed by Kenneth Chi-Yin Wong et al. [5], who directed their focus toward isolating clinical risk factors that alter the trajectory of COVID-19 and leveraging them to anticipate critical cases. They structured four distinct analytical categories, which were modeled using the XGBoost predictive algorithm. The targeted patient cohorts for these analyses comprised: hospitalized/fatal cases versus outpatient cases; fatal cases versus outpatient cases; hospitalized/fatal cases versus a population with no documented infection; and fatal cases versus a population with no documented infection. Evaluation metrics including AUC ROC, recall, sensitivity, specificity, and accuracy were utilized to benchmark the quality of each framework. The reported AUC metrics spanned from 69.6% to 82.5%, recall values extended from 0.5% to 74.8%, sensitivity metrics ranged between 55.7% and 83%, and specificity boundaries fell between 66.6% and 71.9%. The overall accuracy remained comparable across three of the analyses, lingering between 66.5% and 68.6%. The top-performing configuration, yielding an accuracy of 72%, predicted the cohort class of fatal cases versus outpatient cases.
Machine learning models were likewise applied by Krajah et al. in [6] to forecast the target classification of "death", thereby predicting the mortality or survival of a patient based on individual medical conditions and separate predictors. This study was carried out utilizing Mexican patient records provided by the General Directorate of Epidemics. For this application, the investigators utilized a partially structured dataset hosted on Kaggle [7]. Krajah et al. deployed classification models including Logistic Regression, Linear Discriminant Analysis (LDA), Classification and Regression Trees (CART), Support Vector Machines (SVM), Naive Bayes (NB), and k-Nearest Neighbors (k-NN). These frameworks were constructed using 11 predictive attributes, which encompassed features such as "intubated", "icu", "pneumonia", and related indicators. In the final phase of their assessment, they focused primarily on logistic regression and SVM models. Upon optimizing the configurations, they achieved a mean accuracy of 84% for the logistic regression approach and a mean accuracy of 85% using the SVM technique. In comparison, the balanced accuracy metrics for these models stood at 83% and 82% for the logistic regression and SVM frameworks, respectively.
Utilizing machine learning methods, Holy and Rosa [8] forecasted the target class designated as "icu", which represents whether a patient requires placement within an Intensive Care Unit, using the identical data source utilized in the study by [6]. Three variations of SVM models were implemented: the linear kernel, polynomial kernel, and RBF kernel. These architectures were trained utilizing both three-fold and five-fold cross-validation schemes across differing quantities of feature predictors. The top-performing models within their research yielded the following accuracy metrics: linear SVM—77.16%, polynomial SVM—80.44%, and RBF SVM—81.27%. These specific performance values were reached using the configurations operating with five-fold cross-validation and utilizing 16 predictive attributes.
Holy and Rosa [8] relied exclusively on "accuracy" to represent model quality, with their optimal configuration reaching an accuracy of 81.27%. However, documenting accuracy in isolation can provide a skewed perspective, given that alternative parameters such as AUC scores, class-specific precision, or class-specific recall were omitted. In this particular domain, this oversight is critical due to the presence of severely skewed class distributions.
The skewed nature of the classes within this repository [7] (where the positive class accounts for a mere 11% of total entries) can skew the performance of a model, even when resampling or balancing strategies are applied. The AUC metric is sensitive to this imbalance and would likely register a score near 0.5 under poor conditions, showing that the framework lacks class discrimination capability. Under such circumstances, the documented outcomes cannot be deemed reliable, as the model could simply assign nearly all records to the majority classification (0), representing individuals who required no ICU intervention. The core insights from this literature review concerning the ML methodologies relevant to our investigation are organized in Table 1.
Table 1. Summary of related work on ML algorithms.
Authors | Target Prediction Class | Machine Learning Algorithms Applied | Performance Metrics and Outcomes |
Kenneth Chi-Yin Wong et al. [5] | COVID-19 Case Severity Classification | XGBoost-based prediction model | AUC-ROC ranged from 69.6% to 82.5%; recall varied between 0.5% and 74.8%; sensitivity ranged from 55.7% to 83%; specificity was 66.6% to 71.9%; overall accuracy ranged from 66.5% to 68.6%. The highest-performing analysis achieved 72% accuracy when distinguishing fatal cases from outpatient cases. |
Krajah et al. [6] | Patient Outcome Prediction (Death vs. Survival) | Logistic Regression, LDA, CART, SVM, NB, and k-NN | Logistic Regression achieved an average accuracy of 84%, while SVM obtained an average accuracy of 85%. Reported overall success rates were 83% for Logistic Regression and 82% for SVM. |
Holy and Rosa [8] | Intensive Care Unit (ICU) Admission Prediction | SVM with Linear, Polynomial, and RBF kernels | Using 5-fold cross-validation with 16 predictors, the achieved accuracies were: 77.16% for Linear SVM, 80.44% for Polynomial SVM, and 81.27% for RBF SVM. |
Advanced age alongside particular comorbidities, including chronic kidney disease, pulmonary disorders, cardiac disease, and diabetes, constitute well-established indicators of a poorer prognosis in individuals diagnosed with COVID-19 [9, 10]. The presence of multiple concurrent morbidities has generally been demonstrated to exert a substantial impact on clinical outcomes [11]. Beyond these documented chronic conditions, supplementary parameters include obesity, diarrhea, and male sex. Identified laboratory biomarkers encompass hypoxemia, elevated levels of C-reactive protein (CRP), interleukin 6 (IL-6), ferritin, D-dimer, and lactate dehydrogenase (LDH) [12, 13]. Nonetheless, findings across distinct investigations show variations regarding certain metrics.
A retrospective cohort analysis [14] conducted in Wuhan, China, monitored the clinical trajectory and mortality risk factors among patients admitted to the local Jinyintan Hospital and Wuhan Lung Hospital. This investigation incorporated all individuals hospitalized across the specified locations who were above 18 years of age. Demographic, laboratory, clinical, and therapeutic data were leveraged to isolate risk factors via univariate and multivariate logistic regression models. The univariate logistic regression identified diabetes and coronary heart disease as variables linked to mortality in COVID-19 patients. Furthermore, age, lymphopenia, and leukocytosis correlated with fatal outcomes in this analysis. Utilizing multiple logistic regression, the investigators determined that advanced age, an elevated Sequential Organ Failure Assessment (SOFA) score (a diagnostic indicator for sepsis), and D-dimer levels exceeding 1 μg/mL increased a patient's susceptibility to death. They additionally observed that the median duration of viral shedding among surviving individuals was 20 days. Conversely, in patients who did not survive, the coronavirus remained detectable until death.
In a comprehensive global investigation, Orwa Albitar et al. [15] evaluated data regarding risk factors governing coronavirus mortality utilizing public repositories. The objective of this study was to isolate all COVID-19 patients who possessed an unambiguous, individual-level positive test result within the public datasets compiled by Xu et al. in their research [16]. Through this approach, they compiled data encompassing patient demographics, documented comorbidities, and pivotal milestones such as the date of hospital admission, date of a positive COVID-19 test result, date of symptom onset, and date of discharge or mortality. The study concluded that advanced age, male sex, hypertension, and diabetes represented the identified risk factors exerting the strongest influence on mortality among COVID-19 patients. They additionally observed that American citizens testing positive faced an elevated risk of coronavirus-related mortality compared to Asian citizens. Furthermore, chronic pulmonary disease, chronic kidney disease, and cardiovascular disease correlated with COVID-19 mortality, though they were classified as non-significant variables in this specific analysis.
Sven Drefahl and associates detailed a compelling investigation [3] attempting to uncover sociodemographic risk factors that alter COVID-19 mortality. These investigators acquired data from Swedish administrative authorities covering all documented COVID-19 deaths in Sweden up to May 2020. Through survival analysis, they determined that males, individuals with low or no income, persons possessing only a primary education, unmarried individuals, and those born in low- or middle-income nations exhibited an elevated predicted risk of death from COVID-19.
Prior publications evaluating COVID-19 risk factors are synthesized in Table 2. None of these related investigations evaluated the impact of the dominant COVID-19 viral strains on the resulting performance of ML models. Furthermore, the analyses in prior literature were conducted by computer scientists without incorporating expert clinical input.
Table 2. Summary of related work on COVID-19 risk factors.
Study (Reference) | Data Sources Utilized | Approach for Determining Risk Factors | Reported Risk Factors |
Wuhan Cohort Study [14] | Demographic characteristics, laboratory findings, clinical data, and treatment information | Univariate and multivariate logistic regression analyses | Diabetes, coronary heart disease, advanced age, lymphopenia, leukocytosis, elevated SOFA score, and d-dimer > 1 μg/mL |
Global Analysis by Orwa Albitar et al. [15] | Demographic information, comorbidity profiles, and important dates including hospital admission, test confirmation, symptom onset, discharge, or death | Comprehensive assessment using open-access databases | Advanced age, male sex, hypertension, diabetes, and nationality-related differences in risk (American versus Asian). The following factors were associated with outcomes but did not reach statistical significance: chronic lung disease, chronic kidney disease, and cardiovascular diseases |
Sociodemographic Investigation by Sven Drefahl et al. [3] | Records of registered COVID-19 deaths in Sweden | Survival analysis methodology | Male gender, low or absent income, primary-level education only, unmarried status, and birth in a low- or middle-income country |
Informed by the review of prior literature, we formulated three research questions. RQ1: Does data regarding the dominant COVID-19 viral variant alter the predictive performance of the ML models? RQ2: Which feature selection methodology yields superior prognostic outcomes: risk factors chosen by medical specialists or attributes automatically extracted through forward stepwise selection? RQ3: When knowledge extraction is performed utilizing explainability approaches to evaluate how specific comorbidities affect ICU admission forecasts, and these results are compared against selections from domain specialists and FSS respectively, which methodology performs better?
To address these research questions, we utilized open-access data from the investigations reviewed alongside the established CRISP-DM methodology [17]. Throughout all dimensions of our research, medical experts were actively engaged, representing a critical component of the ML and knowledge extraction workflow that is routinely overlooked in equivalent research publications. The subsequent subsections align with the respective phases of the CRISP-DM framework.
Following the onset of the COVID-19 pandemic, commercial enterprises, educational institutions, healthcare systems, and other global organizations faced unprecedented difficulties. Ranging from supply chain disruptions and modifications in consumer trends to the critical demand for precise and rapid decision-making, the pandemic underscored the vital importance of technology in navigating periods of instability. This urgency was arguably most pronounced within the medical sector, where global attention was fixed in anticipation of solutions. Machine learning methodologies have emerged as potent capabilities, as reviewed in [18], for objectives such as diagnosis and detection, forecasting virus transmission and outbreaks, and identifying prospective therapeutic options. In diagnostic tasks, research frequently concentrates on X-ray and CT scan imagery utilizing deep learning ML frameworks [19]. However, identifying abnormalities in X-ray images represented a relatively straightforward task for clinicians. Furthermore, CT imaging lacks the widespread accessibility required for mass deployment during an epidemic. A more intricate challenge lies in isolating the relevant parameters that alter the subsequent trajectory of the illness to effectively execute patient triage and administer appropriate therapeutic regimens. Addressing this objective requires a more extensive scope of patient information, spanning clinical, demographic, and laboratory data.
To fulfill this "business" objective, we deployed machine learning algorithms to categorize patients based on risk factors capable of influencing the disease trajectory in hospitalized individuals, tracking both clinical deterioration and clinical improvement. In the modeling phase, we utilized records from Mexico obtained from the repository of the General Directorate of Epidemiology [20]. We primarily leveraged data from the year 2022, and in instances of severe class imbalance within the target variable, we supplemented this with records from the year 2021. Additionally, data from the year 2020 [7] were incorporated into the modeling phase.
Initially, our modeling efforts targeted two prior investigations: one forecasting patient survival [6] and the other forecasting ICU admission [8]. We replicated these baseline experiments, utilized them as reference benchmarks, and constructed our own models implementing alternative preprocessing techniques and predictors. We evaluated these frameworks using accuracy and integrated information regarding COVID-19 variants to determine if it altered the resulting predictions (to address RQ1).
Subsequently, we executed two experiments comprising two discrete model groupings: the first group implemented predictive features identified as critical by the domain specialist, while the second group implemented predictive features isolated by the forward stepwise selection algorithm (to address RQ2).
Furthermore, we leveraged three distinct explainability methods to evaluate how specific comorbidities impacted ICU admission forecasting. Two approaches were implemented to calculate the global importance of predictors across the population sample (a transparent logistic regression framework utilizing statistical testing alongside the model-agnostic Shapley Additive Explanations—SHAP—method). Additionally, we deployed the local interpretable model-agnostic explanations—LIME—approach to compute the local significance of predictor combinations. The derived set of critical features was benchmarked against selections made via FSS and domain specialists (RQ3).
Following data comprehension and processing, we implemented diverse boosting frameworks, logistic regression, random forests, and alternative classification algorithms to model or isolate the risk factors driving patient admission to ICU environments. We evaluated the success rate of individual models utilizing the AUC metric. Additionally, we recorded the accuracy and precision of these models across both target classes.
The designated dataset obtained from the kaggle.com [7] platform (accessed on 1 March 2023), which was derived from Mexican government records, comprises 23 attributes and 566,602 observations. Among these 23 attributes, 1 feature is numerical, 19 features are nominal, and 3 features represent interval variables structured as calendar dates.
Upon visualizing specific attributes (icu, intubated, and diabetes), we observed that the data exhibited mild imbalances, and for certain variables, the data displayed severe imbalances. In most instances, heavily imbalanced data can induce meaningful complications during the modeling and evaluation phases.
We also conducted a missing value analysis across the dataset. Missing or undocumented variables were represented by the numerical codes "97, 98, 99" within this repository. We substituted these entries with NaN values. Through this missing value assessment, we determined that the attributes "icu" and "intubated" exhibited the highest concentration of missing data, exceeding 78%. Seven attributes within the dataset contained no missing entries.
Additionally, we performed a correlation analysis of the attributes, which revealed that 38 feature pairs possessed a correlation coefficient exceeding 0.8, demonstrating a strong mutual correlation. The most highly correlated pairs of attributes included, for instance, "sex—pregnancy", "patient_type—intubated", and "diabetes—copd" (where copd denotes chronic obstructive pulmonary disease).
The datasets corresponding to the years 2021 and 2022 demonstrate multiple overlapping properties. Both repositories encompass an overall count of 40 attributes, which consist of 4 interval features representing calendar dates, 1 numerical feature specifying patient age, and 35 nominal features. Missing or unidentified variables are systematically coded via the numeric values “97”, “98”, and “99”. The feature descriptors within these repositories were originally maintained in Spanish and have subsequently been translated into English.
While these data records exhibited numerous shared characteristics, prominent deviations were observed between the two periods. A primary divergence relates to the volume of observations contained within each repository. Specifically, the 2021 repository comprised 8,830,345 unique records, whereas the 2022 repository contained 6,330,966 unique records.
Through an analysis of value distributions, it was determined that the target attribute demonstrates a high degree of class imbalance; across both annual datasets, class “1” constitutes less than 10% of total observations once missing data points are filtered out. A designation of class “1” within these records specifies that the individual required hospitalization within an Intensive Care Unit (ICU), whereas class “0” indicates that the individual did not require Intensive Care Unit hospitalization.
In evaluating the missing data entries, the attribute designated as “Migrant” exhibited the highest proportion of missing information across both observation periods. The target cohort variable similarly manifested an extensive volume of missing information, exceeding 93% across both datasets.
Information regarding COVID-19 viral strains was compiled from the GISAID registry (https://gisaid.org/hcov19-variants/ accessed on 1 March 2023), supplying a structure of 6 attributes (2 nominal, 3 numerical, and 1 interval). This dataset aggregates genetic sequencing outcomes from COVID-19 patient samples across diverse nations and timestamps, with specific viral strains designated according to WHO (World Health Organization) terminology. Subsequent data analysis revealed no missing values within this repository.
The graphical representation in Figure 1 illustrates the concentration of the "variant" variable using the 2020 data. The resulting chart highlights a highly asymmetrical breakdown, where the categories "non_who" and "others" clearly make up the largest share of the dataset.
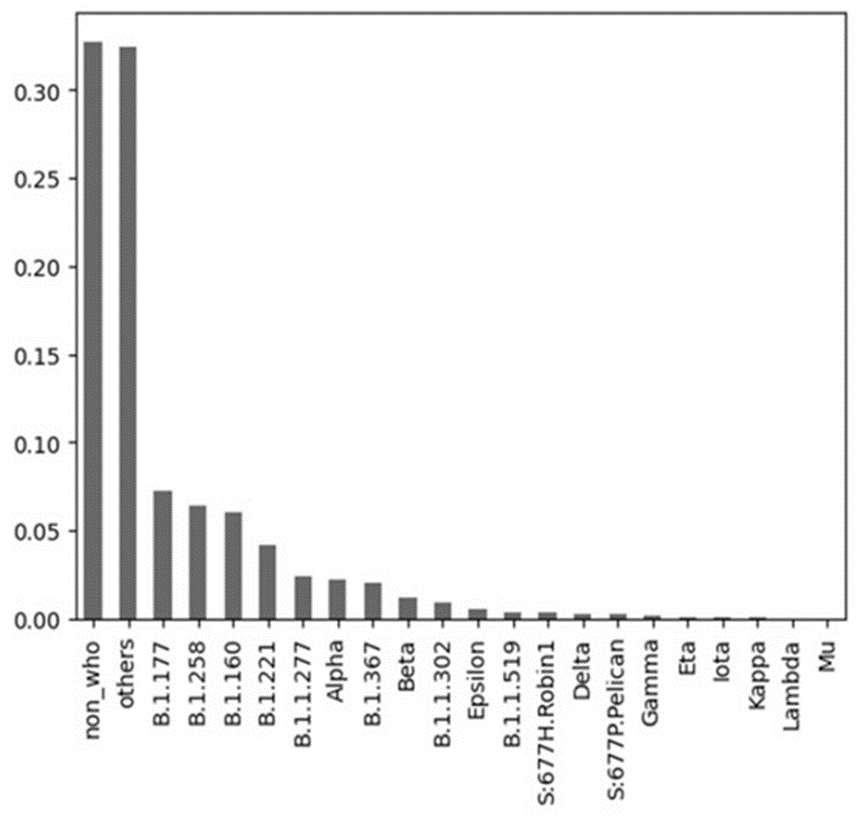
Figure 1. Distribution of values of the variable “variant” for the year 2020.
An examination of the 2021 viral strain frequencies plotted in Figure 2 reveals a contrasting trend. While the overall properties remain comparable, the visual breakdown shows a far more balanced distribution of categories, with clear representations of the "delta", "alpha", and "beta" mutations. Consequently, mapping these viral strains onto the clinical patient records is statistically viable exclusively for the 2021 timeframe, as the 2020 visual breakdown confirms that the data is heavily overwhelmed by the "non_who" and "others" classifications.
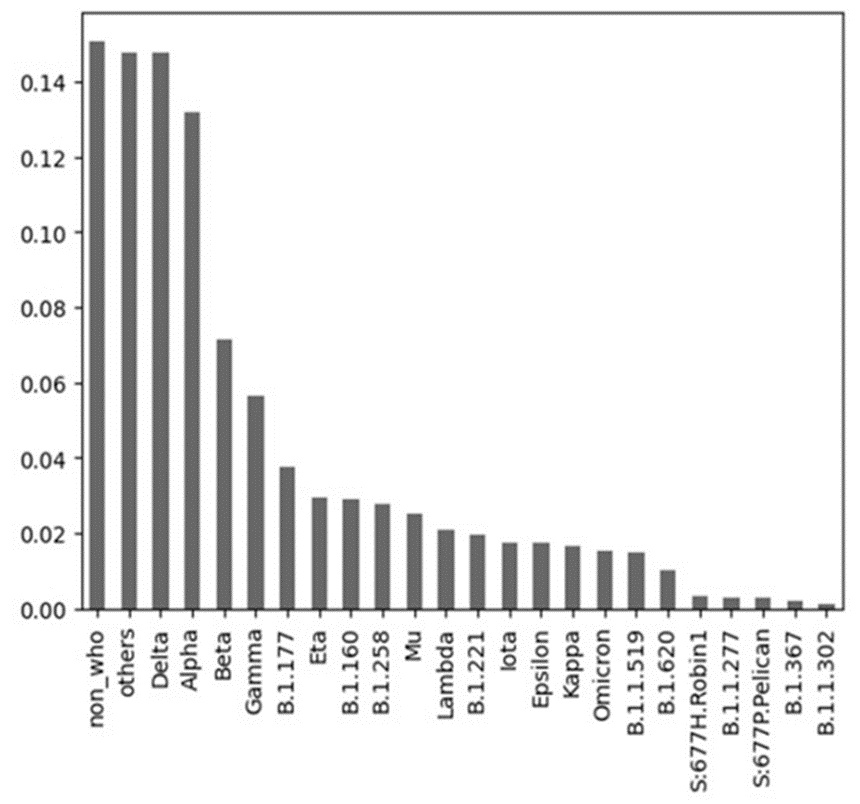
Figure 2. Distribution of values of the variable “variant” for the year 2021.
Standard data preprocessing workflows involved the exclusion of all missing information or the deletion of entire observations containing undocumented records (indicated by NaN or the numeric placeholders 97, 98, 99), which collectively represented roughly 97% to 99.3% of the total repository. Furthermore, a binary target variable labeled “dead” was derived based on the documented date of patient mortality, and an auxiliary feature labeled “incubation_period” was established to capture the temporal span in days separating the initial onset of COVID-19 symptoms from the date of hospital admission. Temporal features including “LAST_UPDATE”, “HOSPITALIZATION_DATE”, “DATE_SYMPTOM”, and “DATE_DEATH” were omitted from the final configuration.
During the preprocessing of the 2021 and 2022 Mexican repositories, feature designations were translated from Spanish to English, and string-formatted categorical features were converted using binary encoding techniques. A composite attribute labeled “y-w” was constructed to encapsulate the year and calendar week of initial COVID-19 symptom manifestation for each record (e.g., 2020-01-01 −> 2020-01), enabling the allocation of the dominant viral strain based on the specific timeframe of symptom onset.
For the preprocessing of the COVID-19 strain repository, observation records originating from Mexico were isolated. A corresponding “y-w” feature was generated to specify the year and week of genetic sequencing, enabling the isolation of the dominant strain for each weekly block.
In this component of the empirical investigation, and to systematically resolve RQ1, the prior research conducted by Krajah et al. [6] was selected as a baseline benchmark. In their study, the investigators implemented multiple machine learning architectures to anticipate patient mortality; however, for our comparative benchmark, we restricted our scope to baseline models without custom hyperparameter optimization, specifically focusing on logistic regression (LR) and random forest (RF) frameworks. Predictive performance was validated utilizing a 10-fold cross-validation methodology.
Leveraging statistical hypothesis testing, the authors of the reference study [6] isolated the following predictive features: intubed, icu, age (61–90), age (0–30), pneumonia, covid_res, diabetes, hypertension, contact_other_covid, age (31–60), and obesity.
Operating on the 2020 data repository, the automated FSS framework isolated the following set of attributes: sex, patient_type, intubated, age, covid_res, pneumonia, diabetes, contact_other_covid, and renal_chronic.
From the 2021 data repository, the automated FSS framework selected the subsequent attributes: pneumonia, type_patient, antigen_sample_taking, age, final_classification, result_antigen, intubated, sex, hypertension, icu, sector_healthcare, renal_chronic, contact_other_covid, other_disease, obesity, origin, tobacco, diabetes, immunosuppressed, hospital_region, cardiovascular, nationality, p_birth_region, p_language_speech, nationality.1, epoc, and asthma. The selection of a greater number of predictive attributes in 2021 is attributable to the expanded scale of the dataset. Replicating the exact data preprocessing pipeline detailed in the reference study [6], we established six distinct classification models.
We executed an alternative experiment to address RQ2, utilizing the study by Holy and Rosa [8] as a baseline reference, focusing explicitly on the target classification “icu” to model whether a patient requires ICU admission. In that reference study, the investigators implemented the SMOTE technique to mitigate target class imbalance and leveraged 5-fold cross-validation for performance assessment. We designated the SVM-linear architecture and the SVM-RBF framework as our reference baselines. The authors of that publication isolated the following predictive variables: pneumonia, patient_type, cardiovascular, other_disease, immunosuppressed, tobacco, asthma, renal_chronic, copd, obesity, diabetes, contact_other_covid, sex, hypertension, covid_res, and incubating_period. Matching the previous experimental setup, we constructed six distinct frameworks to contrast against the reference models, utilizing the identical data preprocessing pipeline implemented by the authors of the baseline study.
For this specific classification task, we elected to consolidate the two aforementioned data repositories representing the years 2021 and 2022. The objective of this consolidation was to augment the data volume for the underrepresented minority class. To harmonize the class distribution within the dataset and optimize the performance of the classification models, we implemented an under-sampling routine known as Tomek Links [21]. This strategy additionally aided in mitigating model overfitting.
(a) Isolating the appropriate features that exert a meaningful influence on predictive outcomes is critical for engineering effective machine learning architectures. Diverse frameworks exist for feature selection, encompassing forward stepwise selection alongside the assessment of attribute importance. For this modeling task, we implemented the forward feature selection technique, which isolated the following variables: type_patient, final_classification, incubating_period, contact_other_covid, sector_healthcare, origin, pneumonia, intubated, hypertension, pregnant, p_birth_city, language_speech, age, nationality.1, renal_chronic, patient_region, migrant, origin_country, and tobacco.
(b) Concurrently, we engaged a medical specialist, an associate professor and practicing physician within the Department of Infectology and Travel Medicine of the Faculty of Medicine at Pavol Jozef Šafárik University in Košice, to guide the identification of critical features from our dataset that possess clinical relevance to the trajectory of COVID-19. The clinically isolated attributes comprised hospital_region, sex, age, pregnant, diabetes, copd, asthma, immunosuppressed, hypertension, other_disease, obesity, renal_chronic, and tobacco. We deployed nine distinct classification models for this predictive task, specifically XGBoost, CatBoost, LightGBM, logistic regression, Naive Bayes, random forest, SGD, SVM-linear, and SVM-RBF.
(c) Beyond independent feature selection workflows and the clinical evaluation of attribute importance by healthcare experts, we implemented multiple global and local explainability frameworks to systematically interpret the relative significance of attributes within the context of specific predictive models to address RQ3.
In the initial phase of this assessment, we constructed a logistic regression model (serving as an inherently transparent explainability framework) and evaluated the global importance of the features. The derived coefficients of this linear logistic model allowed direct interpretation and lent themselves to formal statistical significance testing. This statistical evaluation operated under the null hypothesis that a given model coefficient equals 0, implying the corresponding attribute possesses no predictive value for the classification task. If the resulting test statistic (p-value) of a feature falls below the designated significance threshold (typically 0.05 or 0.01), the empirical sample provides sufficient evidence to reject the null hypothesis, confirming the attribute's significance for classification.
The hierarchical breakdown presented in Table 3 organizes these calculated mathematical parameters and their corresponding thresholds, arranged sequentially from the highest statistically relevant driver to the weakest variable. By establishing a baseline alpha threshold of p = 0.05, the mathematical test successfully isolated 11 distinct attributes that possess genuine statistical relevance for the classification task.
Table 3. Attribute importance based on the logistic regression model for the ICU classification.
Predictor Variable | p-Value | Regression Coefficient |
sex | 0 | 0.2531 |
tobacco use | 0 | 0.1967 |
asthma | 0 | 0.1698 |
age | 1.3263 × 10−69 | 0.0673 |
diabetes | 5.2488 × 10−54 | 0.0477 |
hypertension | 2.0673 × 10−53 | 0.0536 |
chronic renal disease (renal_chronic) | 2.0746 × 10⁻²⁸ | 0.0277 |
other_disease | 3.7978 × 10⁻¹⁹ | 0.0241 |
pregnancy | 3.3495 × 10⁻¹⁶ | 0.0279 |
chronic obstructive pulmonary disease (copd) | 1.221 × 10⁻¹² | 0.0178 |
immunosuppressed status | 1.566 × 10⁻⁸ | 0.0136 |
cardiovascular disease | 0.34459 | 0.0023 |
An alternative post hoc technique utilized to clarify the global significance of features is SHAP. Rooted in cooperative game theory, SHAP leverages Shapley values to distribute payoffs among players according to their individual marginal value to the collective payout. Transposed to machine learning explainability, the features function as the players, while the target prediction serves as the collective payout. Shapley values compute the average contribution of an input variable to an instance-specific prediction across the validation repository. This additive feature significance is illustrated visually in Figure 3. From these outputs, the SHAP framework isolated nine critical features, eight of which intersected directly with the variables identified through the linear logistic configuration detailed above.
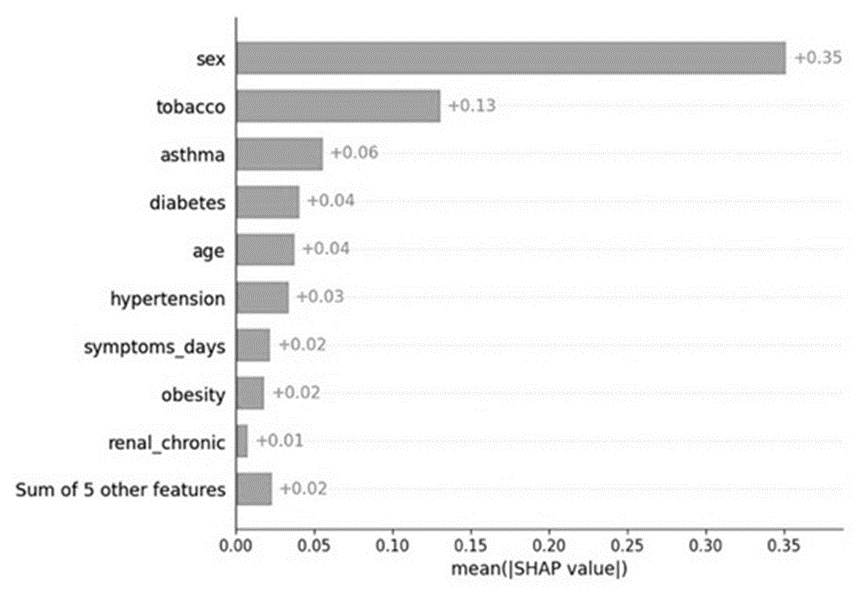
Figure 3. Shapley values of the attributes for the ICU classification.
The aforementioned techniques evaluate feature significance from a global viewpoint. Nevertheless, specific variables may exert influence exclusively across distinct patient cohorts or when intersecting with particular concurrent conditions. To capture these conditional dynamics, we implemented the local interpretable model-agnostic explanations (LIME) technique to assess localized variable interactions. LIME maps local dependencies by approximating the decisions of a black-box architecture using interpretable surrogate models engineered around localized data points. Our workflow involved dividing the data into training and validation segments, optimizing a black-box XGBoost model, and subsequently extracting localized attribute weights across individual validation entries using logistic regression surrogates. The cross-dependencies captured among the primary features are organized via a correlation matrix in Figure 4.
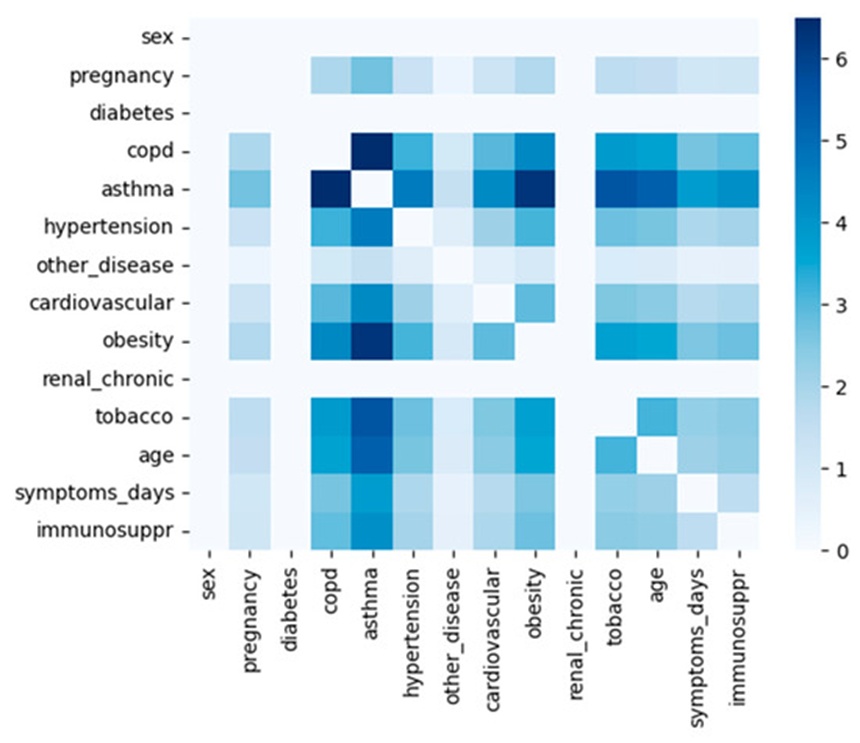
Figure 4. Local interactions among the most important attributes identified employing LIME.
By isolating the five highest-ranking features, we aggregated pairwise interactions across all observations belonging to the positive ICU cohort within the validation set by calculating the sum of products between paired attribute weights. The most prominent feature intersections driving ICU forecasting consisted of asthma-copd, asthma-cardiovascular, and asthma-tobacco.
The illustrated correlation matrix aggregates both positive and negative predictive contributions regardless of whether a binary condition (such as asthma or cardiovascular disease) is active or inactive. To deepen our understanding of model mechanics and diagnose false positive and false negative predictions, we isolated these influences into positive-present, negative-present, positive-absent, and negative-absent combinations. This breakdown evaluates the mean localized weight of a binary variable based on its presence or absence relative to a correct or incorrect ICU classification. The resulting metrics are detailed in Table 4.
Table 4. Positive and negative contributions to the prediction of ICU classes identified by LIME.
Correct ICU Predictions | Incorrect ICU Predictions | ||
not asthma | 0.2290 | False negative | |
not copd | 0.1555 | symptoms_days <= −7 | −0.0608 |
not cardiovascular | 0.1466 | age <= 38 | −0.0416 |
not renal_chronic | 0.1306 | tobacco | −0.0126 |
not tobaco | 0.1195 | cardiovascular | −0.0106 |
not other_disease | 0.1008 | False positive | |
−4 < symptoms_days <= −2 | 0.0190 | not asthma | 0.2164 |
age > 64 | 0.0253 | not copd | 0.1522 |
51 < age <= 64 | 0.0032 | not cardiovascular | 0.1452 |
not renal_chronic | 0.1315 | ||
not tobacco | 0.1109 | ||
not immunosuppr | 0.1095 |
The tabulated outputs reveal that the preponderance of positive classifications stems from the absence of specific morbidities; for instance, a patient presenting without asthma exhibits a high likelihood of avoiding ICU admission, where the mean positive weight driving a true negative prediction for asthma reached 0.2290. The primary binary features isolated via this approach encompassed asthma, copd, cardiovascular, renal_chronic, tobacco, and other_disease, followed by continuous variables tracking the duration of pre-hospitalization symptoms and patient age.
The second column of Table 4 outlines feature interactions driving false negative and false positive discrepancies. From this perspective, the most recurrent drivers of false negative predictions include the duration of pre-hospitalization symptoms (specifically when exceeding seven days), age (for individuals under 38 years), tobacco use, and cardiovascular disorders. Conversely, the variables tracking false positive errors align closely with those driving correct classifications, an outcome caused by the skewed distribution between the sparse positive cohort and the dominant negative cohort. An anomaly to this pattern is the immunosuppr variable, which demonstrated minimal influence on accurate classifications, yielding a low unlisted average weight of 0.006.
Additionally, for continuous variables, we constructed partial dependence plots (PDP) to map the relationship between the target variable (ICU admission probability) and specific input variables of interest by marginalizing out the effects of all remaining features. The resulting marginal response curves for patient age and pre-admission symptom timelines are displayed in Figure 5.
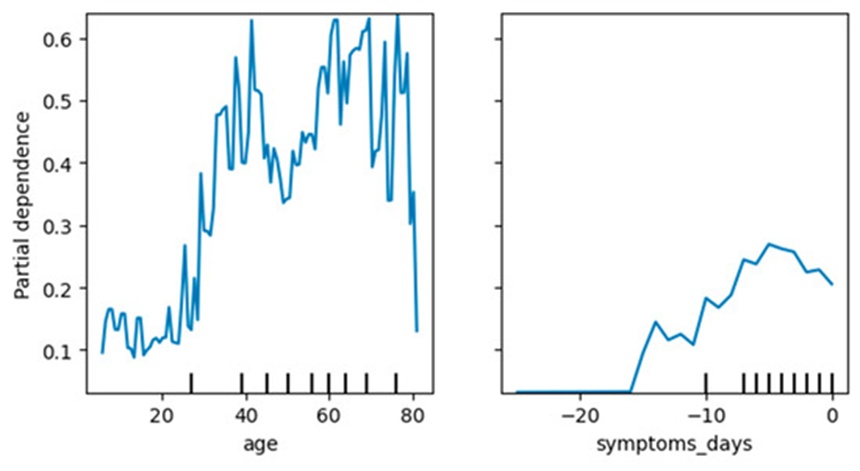
Figure 5. Dependence between ICU prediction, age, and days of symptoms before hospitalization marginalized over the values of all other input attributes plots by PDP.
The age-specific response curve reveals a localized spike in ICU admission probability for patients near 40 years of age, followed by a progressive upward trajectory as patient age exceeds 60 years.
In the initial phase, we conducted experiments to determine if incorporating data regarding the dominant viral strain shifts model performance, benchmarking our results against the reference metrics published by Krajah et al. [6]. These performance metrics are summarized in Table 5.
Table 5. Comparison of models with referential for the target class “DEAD”.
MEX Dataset – Comparative Evaluation of Models for Target Class “DEAD” (Accuracy) | Model 2021 + Variants | Model 2021 | Model 2020 | Reference Model 2020 [6] |
Logistic Regression (LR) Accuracy – Predictors from [6] | 0.7688 | 0.7683 | 0.842 | 0.828 |
Random Forest (RF) Accuracy – Predictors from [6] | 0.75 | 0.7506 | 0.803 | 0.82 |
Logistic Regression (LR) Accuracy – Proposed Predictors | 0.73 | 0.73 | 0.71 | 0.828 |
Random Forest (RF) Accuracy – Proposed Predictors | 0.73 | 0.73 | 0.71 | 0.82 |
The trials utilizing tailored data engineering and custom attribute isolation demonstrated that forward feature selection enhanced predictive accuracy. Nonetheless, the overall accuracies recorded across the 2020 and 2021 sets fell short of the reference benchmarks. In the secondary phase of our experiments, we benchmarked our models against the reference results documented by Holy and Rosa [8] while tracking how viral strain data affected predictive capacity.
As shown in Table 6, our model performance for the 2020 repository remained below the reference baselines, despite implementing the SMOTE routine to balance the target class distribution. The linear SVM configuration yielded an accuracy of 14% for the positive cohort and 93% for the negative cohort. Similarly, the RBF SVM framework registered a 14% accuracy on positive instances and 91% on negative instances. Conversely, when evaluated on 2021 data, both architectures achieved an overall classification accuracy of 96%. The integration of viral variant indicators once again generated no measurable shift in predictive performance.
Table 6. Comparison of models with reference models for the target class “icu”.
MEX Dataset – Performance Comparison for Target Class “ICU” (Accuracy) | Model 2021 + Variants | Model 2021 | Model 2020 | Reference Model 2020 [8] |
Linear SVM Accuracy | 0.9662 | 0.9662 | 0.4101 | 0.7715 |
RBF Kernel SVM Accuracy | 0.9662 | 0.9662 | 0.5631 | 0.8154 |
While our models generated high absolute accuracy scores, subsequent validation showed a lack of class discriminative capacity, yielding an AUC metric of 0.5. This pattern represents a frequent challenge when modeling heavily skewed datasets and remains difficult to overcome given its dependence on data topology. The final experimental segment targeted classification performance for the "icu" variable.
Table 7 displays the performance metrics for models utilizing features selected manually by the medical professional. Pronounced variations in positive class accuracy emerged among the architectures; the CatBoost model reached the highest positive class accuracy (0.83), whereas the Naive Bayes framework demonstrated the lowest capacity (0.24). While the models demonstrated superior accuracy across remaining classes, their overall AUC ROC scores remained compressed.
Table 7. Evaluation of models with attributes important according to the medical experts.
Model | AUC | Accuracy | Precision Class 1 | Precision Class 0 |
XGBoost | 0.57 | 0.87 | 0.35 | 0.9 |
CatBoost | 0.57 | 0.9 | 0.83 | 0.9 |
LightGBM | 0.59 | 0.89 | 0.5 | 0.91 |
Random Forest | 0.52 | 0.88 | 0.4 | 0.89 |
Logistic Regression | 0.54 | 0.89 | 0.6 | 0.9 |
Naive Bayes | 0.59 | 0.82 | 0.24 | 0.91 |
SGD | 0.5 | 0.89 | 0 | 0.89 |
SVM-linear | 0.5 | 0.89 | 0 | 0.89 |
SVM-RBF | 0.5 | 0.89 | 0 | 0.89 |
Table 8 structures the performance metrics for models where predictive features were isolated using the automated forward selection method. Regarding positive class accuracy, the metrics in this group surpass the expert-selected configurations. The top positive class accuracy was recorded by the logistic regression framework (0.92). However, its overall AUC fell below the metrics produced by the XGBoost, CatBoost, and LightGBM models, which maintained strong positive class accuracy while yielding superior AUC values, demonstrating an enhanced capacity to distinguish between target classes.
Table 8. Evaluation of models with attributes according to the forward stepwise selection algorithm.
Model | AUC | Accuracy | Precision Class 1 | Precision Class 0 |
XGBoost | 0.71 | 0.93 | 0.83 | 0.93 |
CatBoost | 0.68 | 0.92 | 0.87 | 0.93 |
LightGBM | 0.71 | 0.93 | 0.83 | 0.93 |
Random Forest | 0.63 | 0.91 | 0.9 | 0.91 |
Logistic Regression | 0.66 | 0.92 | 0.92 | 0.92 |
Naive Bayes | 0.68 | 0.88 | 0.44 | 0.93 |
SGD | 0.51 | 0.88 | 0.29 | 0.89 |
SVM-linear | 0.68 | 0.92 | 0.76 | 0.93 |
SVM-RBF | 0.5 | 0.89 | 0 | 0.89 |
In this study, we implemented machine learning to explore two research inquiries directed at refining our understanding of COVID-19 dynamics. To benchmark our findings, we utilized two reference studies to build prognostic machine learning models targeting the "dead" and "icu" target classes. We initially engineered models replicating the exact 2020 data processing steps outlined in the reference literature, followed by an evaluation utilizing our own data preparation framework.
In the first phase of testing regarding RQ1, we evaluated the 2021 data repository by appending information regarding the dominant viral strain, compiled from external open-access sources. This addition did not alter model capabilities. Across both classification objectives ("dead" and "icu"), the integration of viral strain indicators yielded negligible to zero impact. Consequently, our empirical response to RQ1 based on the available data is negative: integrating data regarding the dominant viral variant does not alter the performance of predictive machine learning models. Although the contemporary dominant Omicron variant causes a significantly milder clinical course compared to historical strains, our source repository captured the pre-Omicron era. Our results indicate that the viral variations circulating during that timeframe did not exhibit distinct differences in mortality rates or ICU admission frequencies.
When evaluating mortality predictions, our models operating on the 2020 data performed comparably to the established reference baselines. In this configuration, models utilizing the 2021 data displayed a minor reduction in performance compared to the 2020 baseline models.
This trend reversed for the "icu" target variable, where our models fell below the reference benchmarks. Markedly improved outcomes were achieved when using the 2021 dataset. These performance variances may stem from multiple operational variables, including differences in training and validation partitions, hyperparameter configurations, or undocumented preprocessing steps executed in the baseline literature.
To address RQ2, we evaluated patient classification for the "icu" target variable to predict whether an individual would require intensive care intervention. This analysis was performed using repositories from the Mexican General Directorate of Epidemiology.
We determined that the classification frameworks achieved optimal performance when utilizing features selected via the automated forward selection algorithm rather than the attributes isolated by the clinical expert. Among the implemented architectures, XGBoost, CatBoost, and LightGBM yielded the strongest predictive metrics. Consequently, the answer to RQ2 is that data-driven knowledge extraction via forward stepwise selection provides superior predictive performance compared to features selected solely through clinical expertise.
Conversely, when interpreting the frameworks from an explainability standpoint to answer RQ3, the medical expert demonstrated significantly higher precision in identifying relevant clinical indicators. The expert's custom selection (13 attributes) captured 10 out of the 11 statistically significant variables isolated by the logistic regression model and its corresponding hypothesis tests. Similarly, for the features isolated via SHAP, 8 out of the 9 high-ranking variables matched the expert's prior selections. In contrast, the automated FSS configuration (19 features) captured only 5 of the 11 significant features isolated by logistic regression and 4 of the 9 features highlighted by SHAP.
Our marginal response curves illustrate a localized peak in ICU admission probability for patients near 40 years of age, followed by a progressive escalation once age exceeds 60 years (Figure 5). This represents a distinct finding, as the majority of published literature states that ICU admission risks rise uniformly with age. Cohen et al. [22] documented data across four European nations showing that the aggregated proportions of individuals aged <40–50, 40–69, and ≥60–70 among total COVID-19 ICU admissions stood at 5.4% (3.4–7.8; I^2 89.0%), 52.6% (41.8–63.3; I^2 98.1%), and 41.8% (32.0–51.9; I^2 99%), respectively. However, because advanced age frequently co-occurs with advanced chronic illnesses, it is necessary to decouple age as an independent risk factor from its interaction with concurrent pathologies. According to findings by Kämpe et al. [23], the clinical risk correlations for comorbidities were generally more pronounced among younger cohorts compared to older demographics.
The determination that the duration of symptoms prior to hospital admission correlates with clinical severity and ICU probability can be explained by the fact that early administration of antiviral therapies such as remdesivir (within 5 days of symptom onset) can mitigate COVID-19 progression. Delayed hospitalization correlates with delayed remdesivir deployment and poorer clinical outcomes, as reported by Falcone et al. [24].
Our empirical outcomes highlight compelling clinical insights and maintain a unique position due to our close collaboration with medical specialists, reflecting a human-in-the-loop methodology. Certain algorithmic boundaries remain due to the inherent properties and scope of the public datasets utilized. Consequently, our future research will focus on engineering a custom, real-world repository derived from approximately 2,500 electronic health records from a regional clinical facility.
None
None
This research was funded by the Scientific Grant Agency of the Ministry of Education, Science, Research, and Sport of the Slovak Republic and the Slovak Academy of Sciences under grant number 1/0685/21, and by the Slovak Research and Development Agency under contract No. APVV-20-0232, and contract No. APVV-16-0213.
None
Open Access The author(s) retain copyright. This article is licensed under the Creative Commons Attribution-NonCommercial-ShareAlike 4.0 International License. It may be shared and adapted for non-commercial purposes with appropriate attribution, an indication of changes, and distribution of adaptations under the same license. Third-party material may be subject to separate terms identified in its credit line. View the license at https://creativecommons.org/licenses/by-nc-sa/4.0/.
 Transparent Intelligence Publishing