This research introduces an innovative prediction framework utilizing a parallel multi-input Bi-GRU structure coupled with a sliding window-based Multi-Input Multi-Output (MIMO) forecasting approach. The primary novelty centers on feature-specific Bi-GRU encoding, which independently processes historical demand, meteorological variables, and calendar indicators prior to data fusion, thereby empowering the network to more effectively capture temporal correlations across disparate data streams. In contrast to preceding models, our methodology distinctively merges a structured feature-specific Bi-GRU encoding mechanism with interpretability via SHAP analysis, providing both superior predictive fidelity and transparent algorithmic decision-making suitable for practical deployment within electrical grids. The introduced Bi-GRU MIMO architecture operates as the foundational model. To rigorously evaluate its performance, an attention-enhanced LSTM model is incorporated solely as a baseline for comparative analysis. Empirical validation using actual data from Singapore’s National Electricity Market System (NEMS) demonstrates that the Bi-GRU MIMO framework enhances forecasting accuracy by 1.64% and decreases MAE by 2.19% relative to traditional models, underscoring its capability to improve decision-making in smart grids.
Driven by the accelerated expansion of the global economy, reserves of finite fossil resources such as coal, petroleum, and natural gas are depleting while their market costs escalate annually, all occurring alongside a rising worldwide demand for electrical energy. Concurrently, the global transition toward sustainable energy alternatives, reinforced by strategic milestones such as the “dual carbon” initiative, is accelerating the phase-out of traditional fossil fuels [1-3]. Within this evolving energy landscape, preserving the flexibility, stability, economic viability, and safety of electrical networks has become a primary hurdle for contemporary and next-generation power infrastructure.
Electrical power requires a virtually instantaneous equilibrium between generation and consumption. This operational synchronization complicates the management of supply-demand stability across the entire power network [4]. High-precision short-term load forecasting (STLF) is vital for sustaining the reliability of power systems, curbing operational expenditures, and reinforcing overarching energy policy goals like environmental sustainability and network resilience. Flawed projections can cause operational inefficiencies, resource misallocation, or systemic blackouts, making predictive precision a strategic necessity for contemporary power grid administration. Excessive generation leads to a waste of energy resources, whereas deficient supply can disrupt industrial output and residential activities, thereby threatening network stability. Consequently, dependable generation and distribution schemes are crucial for grid resilience. Load projection, particularly short-term load forecasting (STLF), represents an indispensable mechanism for achieving this objective by facilitating real-time resource allocation and financial planning strategies. It fulfills a strategic role in the advancement of electrical infrastructure, governmental planning, and the optimization of energy distribution amidst ongoing regulatory and technological transitions. Contemporary trends in grid operations emphasize incorporating a multitude of external factors—including economic metrics, meteorological parameters, and calendar configurations—into predictive frameworks [5]. Nonetheless, many current models continue to experience difficulties in identifying nonlinear correlations and fail to generalize effectively across fluctuating operational states. In China, for instance, regional supply-demand imbalances endure, frequently stemming from the substandard accuracy of local demand forecasting systems.
The advancement of deep learning delivers powerful capabilities to mitigate these constraints. Sophisticated neural architectures such as RNNs, LSTMs, and GRUs have shown exceptional capacity for mapping intricate time-series dependencies within electricity demand data [6]. Modern developments in deep learning have notably enhanced short-term load forecasting and predictive modeling across various fields. A hybrid GRU–TCN–Attention system was developed to manage dynamic characteristics and long-term sequential dependencies in electrical grids, lowering FLOPs by approximately 49% and computational latency by 47% while simultaneously upgrading precision and network dependability [7]. Expanding upon these concepts, this investigation introduces a multi-input predictive framework that merges diverse influential parameters to achieve heightened precision. This paper presents an original Bi-GRU-based Multi-Input Multi-Output (MIMO) framework designed specifically for short-term load forecasting within power networks. The core advancement lies in the structured integration of heterogeneous data streams—including past consumption, similar-day configurations, temperature variations, and calendar classifications—within a deep learning architecture. Furthermore, we execute a comparative benchmarking evaluation using an attention-enhanced LSTM model and perform a feature importance assessment via SHAP to ensure model transparency. This comprehensive algorithmic array delivers both high predictive fidelity and interpretability, fulfilling the practical deployment requirements of contemporary electrical networks. To the best of our knowledge, this represents the initial study to integrate a Bi-GRU-based MIMO architecture with multi-source inputs encompassing past load data, weather variables, and temporal characteristics, optimized explicitly for short-term load forecasting in energy grids. Moreover, we leverage SHAP-based explainability to yield clear insights into feature contributions, thereby reinforcing model transparency and operational governance. This methodological framework provides a domain-specific, explainable solution for upgrading forecasting trustworthiness in real-world utility operations.
Departing from previous literature that deploys generic deep learning frameworks for short-term load forecasting (STLF), our research introduces multiple core innovations:
(1) a parallel, feature-specific Bi-GRU encoding design, wherein heterogeneous data sources (past load, similar-day behavior, ambient temperature, and calendar indicators) are processed independently before feature fusion, augmenting the network's capacity to master cross-type temporal correlations;
(2) a sliding window–based Multi-Input Multi-Output (MIMO) prediction strategy that projects 48 operational periods simultaneously, yielding superior temporal consistency and computational efficiency;
(3) the incorporating of SHAP-based explainability, which is seldom applied in STLF scenarios, providing deep insight into individual feature impacts and thereby refining model transparency and systemic governance; and
(4) thorough feature ablation, sensitivity studies, and statistical significance validation, which critically confirm the architectural decisions and prove the stability of the introduced technique.
These components systematically separate our methodology from traditional STLF frameworks and present both conceptual and functional contributions to demand forecasting within contemporary electrical systems.
Even though Bi-GRU networks and attention-driven LSTM architectures are well-established in sequential time-series applications, our work distinguishes itself by engineering a customized configuration for short-term load forecasting in energy utilities. More precisely, we execute a parallel, feature-specific Bi-GRU encoding methodology that analyzes historical load, temperature variables, and calendar data streams independently prior to their integration. This allows the system to capture subtle temporal trends and cross-dependencies among heterogeneous inputs. Furthermore, we embed SHAP-based interpretability—a feature rarely utilized within STLF structures—to maximize model clarity and assist data regulation in operational environments. To build upon the identified challenges in forecasting accuracy, data heterogeneity, and model transparency, the following section reviews relevant literature on statistical, machine learning, and deep learning approaches for short-term load forecasting. This will help position our study within the broader context and identify gaps our proposed method aims to address.
Core Contributions of this Investigation
Introduces an original short-term load forecasting framework that fuses historical demand, meteorological variables, and temporal characteristics utilizing a Bi-GRU-based MIMO deep learning architecture.
Implements a sliding window methodology tailored for the modeling of multivariate sequential data.
Validates the performance of the model using empirical data from Singapore’s NEMS, proving its superior precision relative to both conventional and hybrid architectures.
Executes a comparative evaluation that includes an attention-driven LSTM network, establishing an empirical baseline measured by critical error metrics (MSE, MAE, MAPE).
The primary goals of this research are structured as follows:
To engineer a Bi-GRU-based MIMO forecasting architecture capable of efficiently synthesizing heterogeneous inputs, such as past load, weather indicators, and calendar variations;
To enhance predictive fidelity and architectural transparency for practical smart grid deployments;
To evaluate our methodology against attention-enhanced LSTM benchmarks; and
To implement interpretability via SHAP values to facilitate informed decision-making in power grid governance.
Short-term load forecasting (STLF) methodologies are generally classified into four primary domains: statistical strategies, machine learning algorithms, deep learning configurations, and hybrid systems. Each category exhibits distinct attributes concerning feature processing, architectural capacity, transparency, and prediction fidelity. This section reviews the prominent techniques within each domain, highlighting their respective advantages and constraints.
Traditional statistical methodologies, such as ARIMA and linear regression models, have frequently been deployed for STLF due to their conceptual simplicity and mathematical clarity. These approaches offer rapid computational execution and yield reliable performance under stationary and linear conditions. Nevertheless, they often fail to capture the intricate, nonlinear behaviors and sequential dependencies characteristic of electrical demand patterns, especially when modulated by external variables such as climate fluctuations and calendar variations. This drawback limits their scalability and practical utility in complex, multivariate forecasting scenarios [8].
With advancements in computational science, more sophisticated predictive algorithms have emerged, most notably Artificial Neural Networks (ANNs) and Support Vector Machines (SVMs). A short-term demand prediction architecture utilizing a BP neural network optimized via simulated annealing has been introduced, demonstrating enhanced convergence by avoiding local minima. These algorithms are highly adept at managing nonlinearity and mapping complex dependencies without requiring explicit underlying assumptions. However, their forecasting capabilities are restricted by a limited capacity to model sequential time-dependencies inherent in time-series data. Additionally, they frequently depend on intensive feature engineering and hyperparameter optimization, which can be computationally intensive and highly susceptible to specific input setups [9-11].
Deep learning architectures have gained significant traction in STLF because of their ability to autonomously extract temporal and nonlinear features from massive datasets. Configurations such as CNNs, RNNs, LSTMs, and GRUs are extensively employed in contemporary short-term load projection literature [12-14]. An RNN optimized via PSO has been introduced, leveraging refined optimization procedures to escape local minima and bolster prediction resilience [15, 16]. These network designs, particularly LSTM and GRU, mitigate vanishing gradient phenomena and are capable of preserving long-term temporal dependencies, rendering them highly suitable for multivariate sequential forecasting.
Furthermore, an STLF strategy founded on a Relevance Vector Machine (RVM) was introduced, delivering sparse and probabilistic projections through Bayesian inference. This model achieved higher efficiency and robustness in noisy environments; however, it lacked the capacity to fully map nonlinear relationships when contrasted with deep learning methodologies [17]. A hybrid framework merging statistical prediction with deep learning for short-term electricity demand projection was also developed. This methodology successfully captured extended seasonality alongside nonlinear temporal trends, outperforming standalone architectures, though its elevated structural complexity and computational demands restrict real-time scalability [18].
Subsequent advancements have incorporated attention mechanisms, as documented in [19, 20], where a hybrid CNN-LSTM network with attention substantially boosted forecasting fidelity by allowing the system to isolate and focus on critical time steps within a sequence. Although deep learning models exhibit exceptional accuracy and adapt well to fluctuating inputs, they are typically resource-demanding and lack transparency, presenting difficulties for interpretation and validation in regulatory or operational settings. Similarly, a deep neural network system combining CNN, LSTM/GRU, and feature selection algorithms has proven effective at managing uncertainty and temporal patterns, surpassing conventional techniques for smart grid energy administration [21].
Hybrid systems combine multiple distinct methodologies to maximize feature extraction and overall predictive performance. For instance, a CNN-GRU model structured around K-means clustering has been proposed to leverage both spatial and temporal characteristics by grouping comparable data samples prior to network training. In the same vein, an advanced load projection framework blending deep CNNs with an Enhanced Gray Wolf Optimizer (EGWO) was introduced to facilitate automated architectural optimization and upgrade accuracy [22-26]. These integrated frameworks generally yield superior forecasting precision and greater generalization capabilities by capitalizing on the collective advantages of their underlying elements.
Beyond power networks, predictive modeling has likewise been applied to financial sectors, where a hybrid LSTM–GRU network exhibited an exceptional capacity to capture both immediate and prolonged sequential dependencies, achieving a 3% improvement in MSE relative to earlier techniques [27]. However, the increased complexity of such multi-tiered architectures, data preprocessing steps (such as clustering), and optimization routines yields substantial computational overhead. Furthermore, these systems frequently function as "black boxes," lacking the explainability required for secure integration into critical infrastructure like power grids.
Additionally, hybrid strategies merging statistical feature extraction with CNN, RNN, and LSTM architectures optimized via Bayesian frameworks have provided highly dependable results for short-term demand forecasting, offering strong utility for energy governance and sustainability efforts [28]. A hybrid CNN-LSTM technique integrated with a feature selection protocol was designed to optimize hourly demand projections within smart solar microgrids. By synthesizing data from advanced metering infrastructures and battery management frameworks, this model captures essential parameters for heightened forecasting fidelity, showing significant accuracy improvements over traditional methods and proving its adaptability for energy management systems [29].
A Bi-GRU model was introduced to classify leakage currents in 15 kV HDPE insulators under diverse meteorological conditions, effectively predicting contamination thresholds to prevent flashover failures and guide preventative maintenance. Comparative assessments indicated that the Bi-GRU structure outperforms standard LSTM and GRU models, improving both classification accuracy and operational reliability [30]. For fault diagnosis in industrial diesel generators, a cloud-AIoT hybrid CNN-BGRU system was developed. Utilizing IoT-enabled sensors and labeled data repositories, this framework accurately identifies system anomalies across fluctuating conditions, with empirical outcomes confirming its superior performance in minimizing error metrics and maximizing predictive trustworthiness relative to state-of-the-art deep learning models [31]. Finally, a hybrid CNN-BiGRU model was presented for three-phase load forecasting in smart solar microgrids using advanced metering infrastructure data. This approach integrates solar, energy storage, utility grid, and meteorological data streams to advance prediction precision, with findings showing that the CNN-BiGRU configuration outperforms traditional RNN, LSTM, and GRU frameworks to effectively support efficient power management [32].
Despite continuous advancements in STLF methodologies, several critical research gaps persist. A primary limitation is that many existing frameworks fail to merge heterogeneous exogenous parameters—such as discrete calendar structures, meteorological variables, and historical consumption data—within a singular, cohesive network architecture. Furthermore, minimal effort has been directed toward benchmarking conventional attention-driven LSTM models against modern deep learning structures, such as Bi-GRU-based MIMO frameworks, within large-scale, operational settings.
This investigation addresses these constraints by introducing a structured Bi-GRU-based Multi-Input Multi-Output (MIMO) prediction model that independently isolates and processes heterogeneous data streams (historical load patterns, temperature metrics, and calendar configurations) prior to feature integration. This methodology improves transparency through post hoc SHAP analysis and elevates forecasting precision via feature-specific sequential encoding. Consequently, it overcomes the common vulnerabilities associated with traditional, machine learning, and basic deep learning techniques—particularly concerning multi-source feature alignment and structural transparency—rendering it highly viable for real-world deployment within modern electrical grids.
In recent years, Transformer-based architectures have received considerable attention in the field of STLF due to their proficiency in capturing long-range sequential relationships and modeling global attention across data sequences. Distinct from RNN or GRU networks, Transformers possess the capacity to process complete sequences concurrently while isolating key input intervals through self-attention mechanisms. Notable developments include the Informer architecture, which efficiently manages extensive time series by leveraging a self-attention design optimized for predictive tasks [33]. Similarly, the FEDformer architecture decomposes sequential data into trend and seasonal components before applying frequency-enhanced Transformer operations. These advanced methodologies have demonstrated superior performance relative to conventional RNN and LSTM networks, particularly when applied to datasets characterized by intricate seasonal cycles and trend dynamics [34-36]. Integrating Transformer-driven strategies into STLF frameworks not only elevates accuracy but also increases training efficiency and structural scalability, making them increasingly viable for modern smart grid systems.
Additionally, this study develops an original loss function centered on the deviation-variance tradeoff. Utilizing dataset examples from an Australian energy market operator and a manufacturing steel plant's load profiles, the empirical results confirm that the introduced model consistently achieves the highest forecasting fidelity when contrasted with alternative comparison baselines.
Many contemporary architectures inadequately leverage diverse exogenous variables (such as categorical calendar indices and continuous weather time series) within a single unified framework. Moreover, the comparative performance between attention-based LSTM models and Bi-GRU-based MIMO configurations remains largely underexplored in broad, real-world utility contexts. There is also a lack of systematic research quantifying the exact precision improvements yielded by feature fusion and structural optimization under uniform benchmarking conditions. This study fills these research gaps by presenting a multi-input Bi-GRU-based architecture that integrates climate, calendar, and historical parameters, supported by an exhaustive benchmarking analysis against existing methodologies. To provide a clearer comparison of these approaches, Table 1 summarizes the strengths and limitations of key models.
Table 1. Summary of reviewed literature
Reference | Model Category | Input Features | Key Strengths | Primary Drawbacks |
Backpropagation Neural Network + Simulated Annealing | Historical load records | Enhanced backpropagation optimization contributes to improved short-term load forecasting (STLF) accuracy | Susceptible to convergence at local optima and lacks explicit temporal dependency modeling | |
CNN, RNN, LSTM, and GRU | Time-series load information | Effective in capturing complex nonlinear relationships within sequential data | Requires substantial computational resources and offers limited interpretability | |
PSO-Based Optimized RNN | Load data combined with optimization techniques | Improved particle swarm optimization helps mitigate local minimum issues | Higher computational overhead compared with conventional approaches | |
CNN-LSTM with Attention Mechanism | Vectorized load-data features | Attention mechanism enhances the modeling of long-term temporal dependencies | Reduced transparency and explainability of model decisions | |
CNN + GRU + K-Means Clustering | Clustered sample datasets | Successfully learns both spatial and temporal characteristics of the data | Relies on manual clustering procedures and involves a complex framework | |
Deep CNN with Improved GWO | Load data along with automated hyperparameter optimization | Enhances CNN structure and forecasting performance through adaptive optimization | Architectural complexity and lengthy training processes increase implementation difficulty |
Despite ongoing progress, specific gaps remain: many models fail to integrate heterogeneous features within a unified framework or offer explainable outputs. Comparative evaluations conducted under consistent benchmarking protocols are likewise scarce. To address these issues, we proposed a Bi-GRU-based Multi-Input Multi-Output (MIMO) architecture that processes historical load, similar day profiles, temperature, and calendar data errors separately before fusion. It incorporates sliding window modeling, one-hot encoding for categorical inputs, and SHAP analysis for interpretability. Benchmarked on Singapore’s NEMS dataset, our model improves both forecasting accuracy and transparency, offering a comprehensive solution to existing limitations in STLF research.
In contrast to existing models that either apply black-box architectures or use fused inputs without clear modular separation, our approach is structurally distinct. It combines feature-specific Bi-GRU encoders, a sliding window-based MIMO prediction strategy, and post hoc SHAP analysis, offering both accuracy and interpretability. Table 1 in this study consolidates performance gaps in previous models and underscores our unique design, which explicitly processes multivariate time series before fusion and enables domain-specific interpretability. In light of these observations, the next section introduces the architecture and mathematical formulation of our proposed short-term load forecasting model based on a Bi-GRU-based MIMO framework.
Alagarsundaram et al. (2024) integrated Restricted Boltzmann Machines with Bi-GRU for short-term load forecasting in power systems. We adopted their Bi-GRU-based approach by incorporating explainable AI techniques in place of RBM for enhanced interpretability. This improves model transparency and supports more reliable decision-making in smart grid operations [37]. Additionally, Nelson et al. (2024) proposed a layered hybrid architecture that integrates statistical models with deep learning techniques for effective time-series forecasting. Inspired by their architectural approach, our work develops a deep Bi-GRU-based model enhanced with interpretable attention layers. This design preserves strong forecasting accuracy while providing transparent and explainable insights for predictions within smart power systems [38].
In the work of Devarajan (2022), an improved backpropagation neural network is introduced for forecasting workload in intelligent cloud computing environments. Our work draws from this by using it as a benchmark to highlight the limitations of feedforward architectures when handling sequential power load data which leading to improved accuracy and forecasting robustness in dynamic power grid scenarios. Our proposed short-term load forecasting framework adopts the real-time, GRU-based sequential learning strategy emphasized by Gudivaka (2022) to support responsive prediction in data-intensive environments. By aligning this approach with smart grid applications, our model ensures timely and accurate load forecasting, thereby enhancing operational decision-making in power system management. Finally, Parthasarathy (2023) introduced a hybrid model utilizing case-based reasoning, clustering, and evolutionary algorithms for multi-class workload forecasting. We applied their evolutionary optimization techniques in our work for refining hyperparameters and improving model performance. This integration helps boost the predictive power and adaptability of our Bi-GRU-based system [39-41] (Figure 1).
Artificial neural networks are established by replicating the information processing mechanisms of biological neural structures within the human brain, endowing them with powerful non-linear mapping capabilities. Consequently, implementing a network model with exceptional curve-fitting proficiency is a logical selection for this predictive task, as it circumvents the challenges associated with creating an explicit variable space to define a rigid mathematical framework.
In this investigation, short-term electrical load forecasting serves as the core focal point of the global framework and is analyzed as the target objective. We deconstruct the neural network model to isolate its fundamental operational parameters. The primary stage involves initializing the structural parameters and leveraging the prepared feature matrix to calculate the network's output, representing the load predictions generated under the initial parameter configuration. The secondary stage centers on the backpropagation optimization of these parameters. Here, the partial derivatives of the system parameters are computed via the chain rule to update the existing weights and biases. Ultimately, training the parameters of a neural network model focuses on identifying the optimal weight configurations and bias vectors following model initialization.
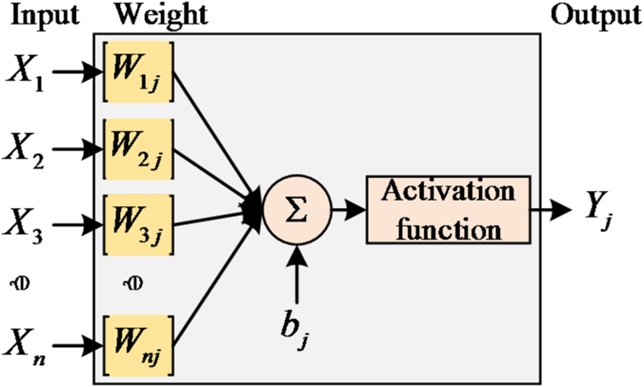
Figure 1. Short term load forecasting neuron structure
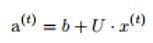
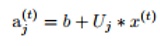
Within the network framework of short-term load forecasting (STLF), the output vector calculation of the initial layer is formulated as follows:
 (1)
 (2)
Subsequently, the resulting output neuron is expressed as:
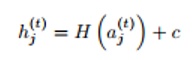 (3)
Where xi represents the input value directed to neuron i, wij denotes the connection weight linking neuron i to neuron j, bj signifies the associated bias term, and bj indicates the final output of neuron j. The activation function f(· ) is typically a non-linear operator such as the Rectified Linear Unit (ReLU).
Consequently, the short-term electrical load forecasting task targeted in this investigation can be abstracted into a multivariate mathematical framework. The corresponding characteristic function can be defined as:
 (4)
 (5)
 (6)
Thereafter, we can formally express the abstract operational field through the following mathematical formulation:
 (7)
Within these expressions, \hat{Y} denotes the projected electrical load output, X represents the comprehensive feature matrix encompassing historical load sequences, temperature measurements, and calendar indicators, while \theta signifies the complete set of trainable network parameters (consisting of weights and biases). The term L defines the objective loss function optimized during the training phase. Following the execution of data preprocessing operations on the electrical consumption records, load prediction can be systematically carried out. Figure 2 outlines the operational phases extending from initial data preparation (historical load sequences, meteorological features, and calendar indicators) to Bi-GRU network training, output prediction, and performance evaluation.
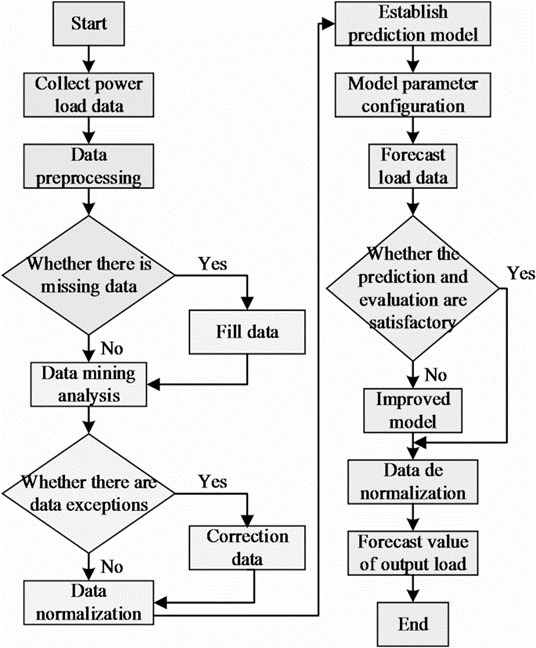
Figure 2. Power load forecast flow chart
Bi-GRU network can output complete information of the whole load data through two-way training of time series. Figure 3 shows the neural network structure of power load forecasting. This represents the separate feature streams (historical load, similar-day load, temperature, and date type) are independently encoded, fused, and passed through fully connected layers to generate predictions.
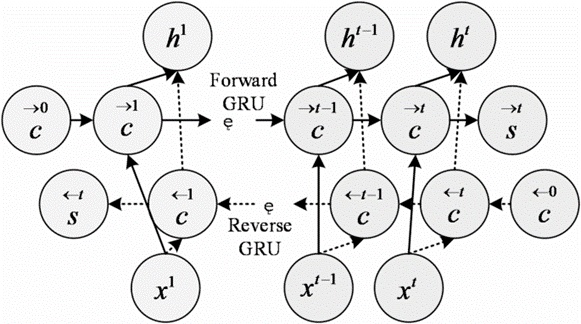
Figure 3. Neural network model for power load forecasting
As established, systematically organizing the exogenous variables directed into the prediction framework is vital for ensuring model convergence and enhancing forecasting accuracy. To achieve this, the present study establishes a multi-factor feature space structured around three foundational dimensions: similar-day load profiles, meteorological dynamics, and calendar indices. The weather component incorporates the dry-bulb temperature data synchronized with time step t on the targeted projection day, while the calendar component isolates specific day-type attributes. Notably, similar-day profiles and meteorological variables are continuous metrics, whereas calendar indicators represent discrete categories.
The strength of linear association among the continuous parameters—specifically past consumption and ambient temperature—is quantified using the Pearson correlation coefficient. Conversely, discrete parameters are omitted from Pearson correlation mapping to respect their mathematical nature; however, their structural features are preserved within the global input pipeline. Consequently, statistical correlation profiling is restricted strictly to continuous inputs. The paired correlation tracking between these variables is mapped independently, with the resulting distribution detailed in Figure 4. This visualization reveals that similar-day profiles display highly robust positive correlation values ranging between 0.72 and 0.99, whereas the ambient temperature feature yields a significantly weaker, inverse correlation value of –0.20. To ensure the informational completeness of the global input domain, all engineered features are intentionally retained.
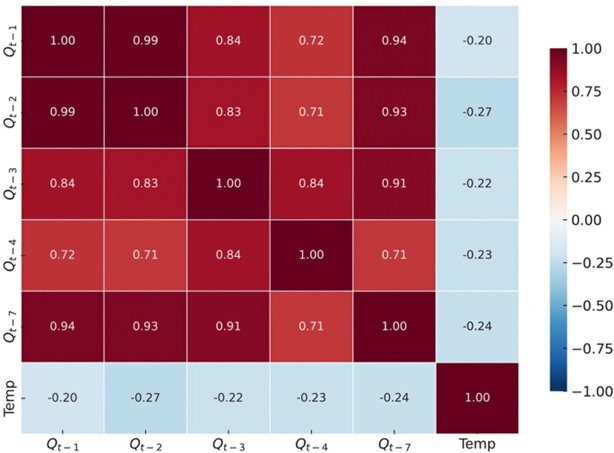
Figure 4. Correlation coefficient of short-term load forecasting of power grid
The empirical thermodynamic matrix demonstrates that the correlation markers linking historical electricity demand with the respective similar-day indicators stand at 0.99, 0.84, 0.72, and 0.94. Because these values signify exceptionally strong statistical associations, all similar-day profiles are deemed operationally critical and are fully integrated. In contrast, the dry-bulb temperature metric exhibits a marginal correlation score of only −0.2 relative to historical demand, characterizing it as a weak predictor. Nonetheless, to safeguard the comprehensive nature of the predictive feature set, this weather variable is retained. Building upon this foundation, this investigation layers day-type classification properties alongside similar-day consumption and dry-bulb temperature, synthesizing these three external forces into a cohesive feature ecosystem. Furthermore, to enrich the network with long-range sequential intelligence, the three continuous variables—historical load, similar-day demand patterns, and temperature trajectories—are processed and trained strictly as sequential time-series blocks.
To smoothly incorporate these multi-source variables into the predictive architecture, inputs undergo systematic conditioning and aggregation through a modular preprocessing pipeline. Specifically, the framework segregates historical consumption, weather conditions, and temporal features based on their primary data topologies: continuous sequential time series (encompassing past demand, similar-day trajectories, and temperature fluctuations) and categorical data structures (comprising discrete calendar variations). Continuous vectors are systematically partitioned via a sliding window protocol to generate uniform sub-sequence samples, while categorical day classifications are restructured using standard one-hot encoding binary operations. These conditioned streams are subsequently directed into a parallel, Bi-GRU-driven Multi-Input Multi-Output (MIMO) deep learning network, where they are fused to capture concurrent temporal dynamics alongside categorical contextual shifts. This holistic feature alignment substantially reinforces the model's capacity to deliver highly precise 24-hour-ahead electricity demand projections.
While ambient temperature shows a minimal statistical association with power consumption (correlation coefficient \approx -0.2), retaining this variable ensures architectural data integrity. Subsequent post hoc explainability via SHAP demonstrates that even marginally correlated inputs are vital for stabilizing forecasts, as they capture complex edge-case variations that typically emerge during volatile seasonal transitions.
The NEMS dataset serves as an exceptionally robust foundation for empirical testing due to its multi-year operational span and high-frequency, 30-minute sampling sequence. This granular logging captures an expansive array of intraday, weekly, and seasonal consumption cycles across fluctuating climate patterns and distinct utility operational contexts. The empirical data environment primarily integrates historical load records, climate variables, day-type metrics, and related exogenous forces. The active electrical power records are sourced directly from the National Electricity Market of Singapore. NEMS represents the pioneering liberalized wholesale power market across Asia, where all electrical energy transactions are cleared through dedicated energy market operators. Because these operators function as the central trade clearinghouses for wholesale energy, electrical consumption data is logged strictly at 30-minute intervals, causing the daily load variations to form a sequential time series consisting of 48 distinct data points.
The temporal window chosen for data collection spans 720 days, beginning January 8, 2018, and concluding December 28, 2019, yielding an aggregate data repository of 34,560 observations. The secondary portion of the data environment includes climate records paired with weekly calendar features. Weekly properties are extracted via calendar indexing and transformed using unique hot-key categorical structuring. The designated Singapore weather monitoring station is logged under station identifier 48,698,099,999, situated at longitude 103.99 and latitude 1.35. The sampling frequency of these meteorological records is similarly set to 30-minute steps, resulting in an identical 48-point matrix per day. All empirical modeling in this section is executed leveraging a TensorFlow 2.4.1 backend and a Keras 2.4.3 deep learning environment, operating within a Python 3.7.6 framework. As illustrated in Figure 5, the input sequences (historical load, temperature, and calendar features) are segmented into overlapping windows of 48 time steps, enabling the model to learn temporal dependencies for 24-hour-ahead predictions.
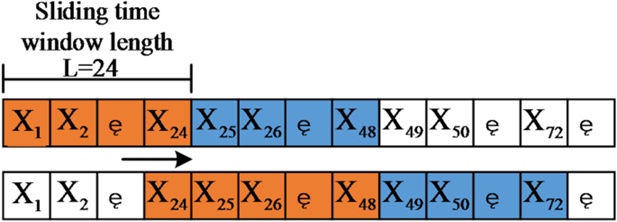
Figure 5. Sliding time length and short-term load forecasting (STLF) model
This investigation deploys a translating window methodology to divide the primary load and temperature time series into multiple sub-sequences. This step initially partitions the dataset into 27,648 training records, 3456 validation entries, and 3456 independent test instances. Generally, historical consumption matrices exhibit massive numerical magnitudes, which can disproportionately dominate network training dynamics and hinder rapid optimization convergence. To mitigate this, the load and temperature profiles are standardized and processed through a translating sliding window. Given that each daily cycle for load and climate variables comprises 48 discrete measurements, the operational window length is locked at 48. Under this arrangement, data points from the preceding 48 periods are evaluated, and the subsequent load value at time step t (representing the 49th operational point) is defined as the target output label. The window then translates forward by a single increment, repeating this systematic extraction across the entire horizon to generate a dense dataset of sub-sequences.
For a sequential time series containing m observations, a total of m - 48 + 1 sub-sequences can be successfully derived through this window translation approach. Because the output layer of the proposed MIMO architecture is configured with a dimension of 48, it possesses the capacity to project a 48-point horizon simultaneously, matching the 48-point load profile of an entire daily cycle. Consequently, this alignment yields 27,552 distinct training samples along with 3360 separate validation and testing blocks. Furthermore, in contrast to basic numerical quantization, the deployment of one-hot encoding preserves the natural cyclical sequence of the weekly calendar without imposing artificial mathematical relationships between different days. Thus, day-type variables are converted via unique hot-key encoding to construct a 7-dimensional sequential input matrix for the network, as detailed in Table 2. Weekday features were encoded using standard one-hot encoding, where each day of the week is represented as a 7-dimensional binary vector with a single active (‘1’) value indicating the respective day.
Table 2. Single heat code of day type
Section | Parameter | Value |
Date Type One-hot Encoding
| Monday | 1,000,000 |
Tuesday | 0100000 | |
Wednesday | 0010000 | |
Thursday | 0001000 | |
Friday | 0000100 | |
Saturday | 0000010 | |
Sunday | 0000001 | |
Model Parameters
| Window Size | 48 |
Number of Bi-GRU Units | 64, 64 | |
Hidden Layer Units | 128, 64 | |
Activation Function | ReLU | |
Optimizer | Adam | |
Frequency | 50 | |
Batch Size | 64 | |
Loss Function | MSE |
The individual sample arrays directed into the input layer of the Single-Input Single-Output (SISO) baseline configuration maintain a shape of (48 * 13), where 48 specifies the temporal window capacity and 13 denotes the comprehensive feature dimensionality. Conversely, the multi-input network layout ingests three isolated data matrices: a load tracking matrix with dimensions of (48 * 5), a meteorological matrix with dimensions of (48 * 1), and a calendar day matrix with dimensions of (1 * 7). The final output dimensions are fixed at (1 * 1) for the single-output baseline framework and (1 * 48) for the multi-output network configuration. Additional structural parameter arrangements are summarized in Table 2.
To guarantee complete computational reproducibility and clarify the underlying learning dynamics, all neural network weights are initialized utilizing the He uniform initialization approach. Network training is conducted via the Adam optimization algorithm, operating with an initial learning rate of 0.001 and featuring no learning rate decay. This constant, non-decaying learning schedule is maintained uniformly across the entire training timeline. To combat potential overfitting and stabilize the network, robust regularization measures are implemented, including dropout layers configured with a dropout rate of 0.2 alongside L2 weight regularization (\lambda = 1\text{e-}4) applied across all trainable weight matrices. Network training is regulated via an early stopping protocol with a patience threshold of 10 epochs, dynamically tracking validation loss variations. The operational batch size is set to 64, and the maximum training limit is bounded at 100 epochs, utilizing a gradient clipping threshold of 1.0 to suppress exploding gradient phenomena. To maximize experiment reproducibility, a fixed random seed of 42 is enforced across all computational trials. Every phase of model development and testing is deployed within a Python 3.7.6 programming environment using TensorFlow 2.4.1 and Keras 2.4.3 libraries.
In accordance with the structural load analysis and the mathematical properties of deep neural networks , the raw consumption values are standardized prior to processing to handle the broad numerical spans typical of real-world load data. The resulting load forecasting scheme is illustrated in Figure 6. This visualization highlights how integrating the Adam optimization routine, dropout regularizers, and early stopping protocols advances training stability and increases prediction accuracy over standard baseline models.
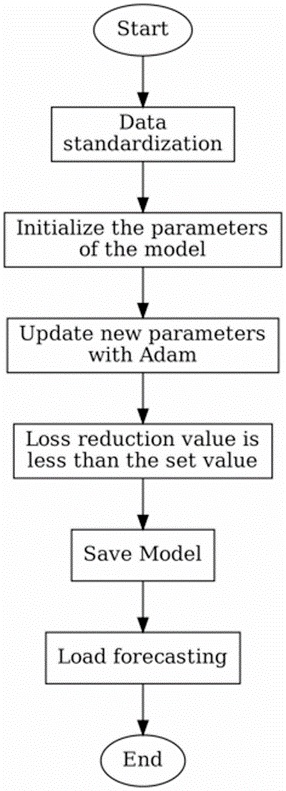
Figure 6. Optimization for short-term load forecasting of power grid
In summary, this section provides a systematic breakdown and review of the deep neural network architecture. It outlines the mechanics of the Adam optimizer, which acts as a powerful alternative to traditional gradient descent frameworks for updating deep learning weights—an algorithm widely endorsed within the time-series forecasting domain. Furthermore, this section defines the empirical data sources used in this research and outlines the construction of the input feature space. This space undergoes uniform data standardization prior to load forecasting to ensure a comprehensive, multi-dimensional assessment of the predictive framework. To enhance model performance, the Adam optimizer and an early stopping routine (patience = 10) are utilized to guarantee stable convergence. Dropout regularizers (rate = 0.2) are embedded to prevent overfitting. Essential hyperparameters, including hidden GRU block capacities (32, 64, 128 units), batch configurations (32, 64), and dropout thresholds are systematically refined via an extensive grid search strategy. The Rectified Linear Unit (ReLU) activation function is deployed across hidden layers to unlock accelerated training convergence. Collectively, these optimization strategies bolster the structural robustness of the model and maximize overall prediction accuracy.
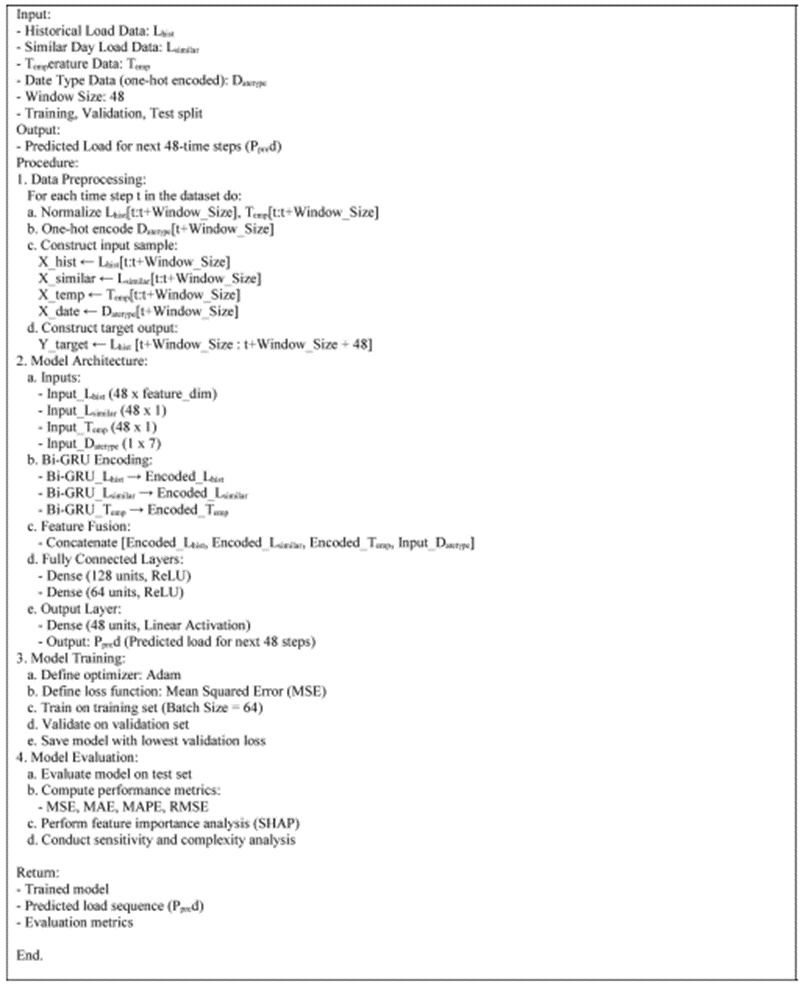
Algorithm 1. The step-by-step mathematical logic and structural workflow of the proposed Bi-GRU-based MIMO forecasting architecture are formalized.
The Bidirectional Gated Recurrent Unit-based Multi-Input Multi-Output (Bi-GRU-based MIMO) network was selected due to its capacity to capture bidirectional sequential dependencies and concurrently process heterogeneous inputs, including antecedent load profiles, meteorological fluctuations, and temporal indices. When contrasted with conventional LSTM, standard GRU, and attention-based architectures under identical computational constraints, the Bi-GRU demonstrated enhanced learning stability and superior generalization capabilities.
Hyperparameters were systematically calibrated utilizing a grid search methodology. Key architectural design decisions—including the implementation of the Rectified Linear Unit (ReLU) activation function to accelerate convergence rates, the adoption of the Adam optimizer for adaptive learning rate scheduling, the integration of a 0.2 dropout rate to prevent overfitting, and the designation of a 48-step window length to match the 24-hour-ahead forecasting horizon—were determined through empirical evaluation and validated by existing literature. To guarantee stable optimization convergence, an early stopping mechanism with a patience threshold of 10 epochs was applied. Ultimately, the framework and its corresponding parameters were established based on their theoretical alignment, operational robustness, and suitability for handling the multivariate complexities inherent in power demand forecasting.
Our proposed architecture introduces a customized Bi-GRU-based MIMO framework that ingests independent temporal feature streams—specifically historical load trajectories, similar-day profiles, meteorological variables, and calendar attributes—before merging them into a unified multi-step prediction vector. Departing from conventional hybrid or opaque deep learning networks, this methodology integrates post-hoc explainability through SHAP values, providing transparent insights into how distinct input parameters influence final forecast outputs. This integration of sophisticated recurrent sequence modeling and structural interpretability delivers a novel forecasting framework uniquely aligned with the practical operational demands of modern power networks.
To advance the precision of short-term load forecasting, this research analyzes multiple deep learning paradigms uniquely suited for temporal sequence analysis: Recurrent Neural Networks (RNNs), Long Short-Term Memory (LSTM) models, and LSTM networks integrated with attention mechanisms.
Recurrent Neural Networks (RNNs) represent a foundational architecture for processing sequential data structures. They function by recursively feeding the hidden state of a preceding time step as an input into the subsequent step, creating an internal memory mechanism. However, while computationally efficient for short-duration sequences, standard RNNs frequently struggle to capture long-range dependencies due to vanishing or exploding gradient phenomena, which ultimately degrades their predictive accuracy over extended forecasting horizons.
Long Short-Term Memory (LSTM) networks were specifically designed to overcome these structural constraints. LSTMs incorporate specialized internal mechanisms termed "gates" that regulate information routing, allowing the model to retain relevant contextual information across prolonged temporal gaps. This architectural capability makes LSTMs highly effective at identifying the intricate, long-range patterns common to electrical demand datasets.
The integration of an Attention Mechanism with an LSTM architecture enhances the conventional model by enabling the framework to dynamically prioritize pivotal segments within the input sequence. Rather than assigning uniform weights to all historical observations, the attention mechanism distributes varying degrees of importance across individual time steps. This targeted focal mechanism allows the network to generate highly informed predictions, particularly when specific temporal points exert a disproportionate influence on future demand. Within our experimental evaluations, the attention-enhanced LSTM configuration achieved the highest forecasting performance. As demonstrated in Tables 6 and 7, it consistently surpassed both the baseline LSTM and traditional RNN architectures across all evaluated accuracy and error metrics. These empirical outcomes validate that the incorporation of attention-based processing yields a more powerful framework for learning temporal dynamics within electricity load forecasting.
The deployment of these deep learning models is theoretically grounded in established engineering research, including the pioneering LSTM design and the sequence-to-sequence attention mechanism introduced by [42, 43]. These methodologies have achieved widespread validation across diverse time-series forecasting frameworks and natural language processing applications.
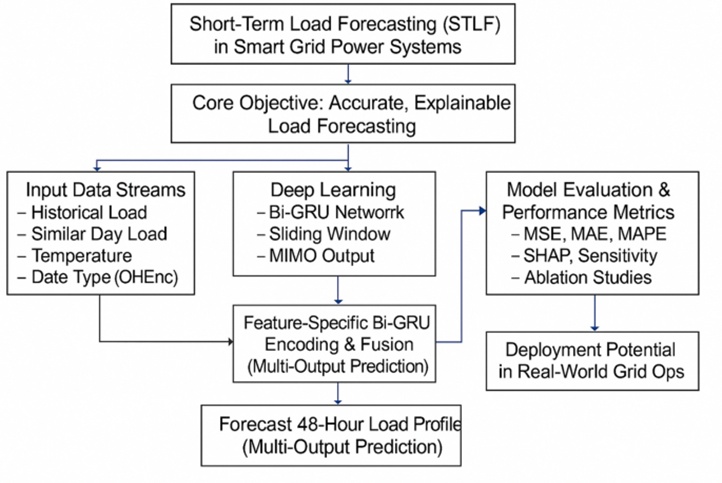
Figure 7. Conceptual Map: Bi-GRU-Based MIMO Framework for Short-Term Load Forecasting
Figure 7 delineates the operational workflow of the proposed Bi-GRU-based Multi-Input Multi-Output (MIMO) prediction architecture. To begin, four distinct feature streams are engineered: (1) historical load patterns, (2) similar-day load profiles, (3) ambient temperature fluctuations, and (4) categorical day types processed via one-hot encoding. Each individual stream is systematically processed through an independent Bi-GRU module to isolate its respective temporal characteristics. Subsequently, these isolated feature representations are concatenated into a singular, integrated matrix. This fused feature vector is then routed through a series of fully connected layers to produce the 48-step-ahead electricity demand forecast. Finally, SHAP analysis is applied to the network outputs, introducing structural interpretability by quantifying the exact mathematical contribution of each constituent input variable.
To execute a thorough performance verification of the predictive models, widely accepted statistical evaluation metrics were utilized: MAE, MAPE, RMSE, and MSE. The MAE delivers a direct representation of the mean error magnitude, rendering it highly intuitive for field-level utility decision-making. The MAPE quantifies forecasting deviations in a percentage format, facilitating normalized comparisons across distinct operational scales. The RMSE penalizes larger, out-of-distribution variations by squaring individual errors, which assists grid operators in identifying significant, high-risk prediction failures. The MSE serves directly as the loss function during model training, providing a differentiable surface to ensure smooth gradient optimization. Collectively, this metric suite accounts for both central accuracy tendencies and sensitivity to volatile outliers, enabling a comprehensive validation of short-term load forecasting performance. To quantify the predictive accuracy of the proposed and baseline frameworks, the following standard statistical metrics are deployed:
 (8)
Mean Absolute Error (MAE): Measures the average magnitude of errors between predicted values Pi and actual values Ai, without considering their direction.
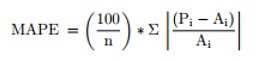 (9)
Mean Absolute Percentage Error (MAPE): Expresses the prediction error as a percentage, making it suitable for comparing across datasets with different scales.
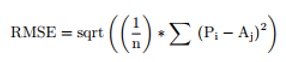 (10)
Root Mean Squared Error (RMSE): Provides a measure of the average magnitude of the error, giving higher weight to larger errors.
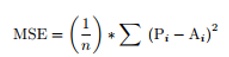 (11)
Mean Squared Error (MSE): Useful for measuring overall error performance and penalizing larger deviations.
 (12)
Coefficient of Determination (R2 ): This metric indicates the percentage closeness of the predicted values to the actual values and complements the error-based metrics for interpretability.
Where: Pi denotes the predicted power load at time step i; Ai represents the actual power load at time step i; n is the total number of time steps in the prediction window; MAE, MAPE, RMSE, and R2 follow standard definitions in load forecasting literature. These metrics provide a comprehensive assessment of model performance in terms of precision, stability, and robustness.
To execute a more rigorous and extensive assessment of the framework's predictive performance, supplementary Key Performance Indicators (KPIs) are introduced. These consist of Mean Absolute Relative Error (MARE), Root Mean Square Relative Error (RMSRE), Mean Square Relative Error (MSRE), and Root Mean Square Percentage Error (RMSPE). Implementing these metrics provides deeper insight into the variance distributions and structural properties of the forecasting errors.
MARE is defined as the average of the absolute relative errors:
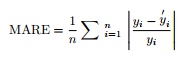 (13)
RMSRE measures the square root of the mean of the squared relative errors:
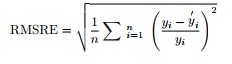 (14)
MSRE is the mean of squared relative errors:
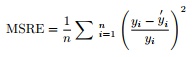 (15)
RMSPE is the root mean square of percentage errors:
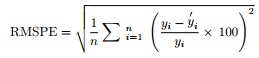 (16)
These relative metrics are highly effective for contextualizing the magnitude of prediction deviations relative to true baseline demands, thereby providing a clearer evaluation of model reliability and structural resilience. Table 3 summarizes these extended metrics for the baseline RNN architecture and the improved attention-driven LSTM network.
Table 3. Extended KPIs for RNN, LSTM, and LSTM-Attention models
Model Category | RMSPE (%) | RMSRE (%) | MSRE (%) | MARE (%) |
RNN | 9.11% | 9.22% | 0.85% | 8.42% |
LSTM | 7.53% | 7.00% | 0.49% | 6.13% |
LSTM with Attention | 5.84% | 5.09% | 0.26% | 3.81% |
Within stochastic neural network optimization regimes, standard stochastic gradient descent (SGD) can potentially compromise global convergence precision. This occurs because executing parameter adjustments on an individual sample basis does not guarantee a monotonic reduction in objective loss across the entire data collective. To circumvent this vulnerability, our framework evaluates the aggregate training loss following each parameter update sequence. If the current epoch's comprehensive loss registers below the previously recorded minimum, the network updates the baseline minimum threshold and archives the corresponding weight and bias matrices in an isolated storage directory.
As shown in Table 4, the output space targets the load profile mapped to the k-th operational day. Because real-world power demand spans broad numerical orders of magnitude, the raw load datasets undergo a standardization protocol utilizing Eq. 3 to maximize processing efficiency, yielding the formatted profiles summarized below.
Table 4. Data results after standardization
Input Neuron | Input Variables |
1 | - |
2 | k-7 |
3 | k-1 |
4 | k-1 |
1 | Load in the t hour of the kth day |
To clearly distinguish the predictive variations between the actual load trajectories and the generated forecasts of the two baseline models, the vertical axis in Figure 8 is truncated to originate at 100 MW.
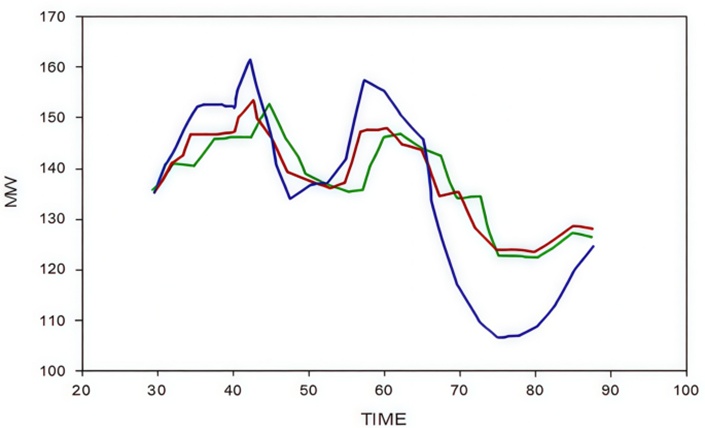
Figure 8. Comparison Chart of short-term load forecasting (STLF) Results
The trajectories presented in the illustration explicitly highlight the optimized fitting behaviors and elevated forecasting precision yielded by the enhanced network, confirming that the optimized load curve tracks real-world demand with high fidelity. Figure 8 depicts the alignment between projected and actual consumption profiles, where the blue curve denotes empirical load sequences, the red curve traces predictions from the traditional DNN architecture, and the green curve corresponds to the enhanced DNN configuration. The optimized framework closely shadows operational peaks and valleys, markedly minimizing overall error bounds. Table 5 details the calculated accuracy vectors across multiple dimensions, providing clear metrics to guide the selection of operational parameters for sustained precision and structural stability.
Table 5. Error comparison of improved algorithm
Model Category | RMSE (%) | MAE (%) | MAPE (%) | Accuracy (%) |
Traditional DNN (2-layer) | 9.57 | 7.66 | 6.23 | 93.7 |
Improved DNN (2-layer) | 9.23 | 7.53 | 6.02 | 94.00 |
Traditional DNN (3-layer) | 7.32 | 5.82 | 4.70 | 95.33 |
Improved DNN (3-layer) | 7.16 | 5.75 | 4.63 | 95.38 |
Traditional DNN (4-layer) | 7.57 | 6.55 | 5.03 | 94.93 |
Improved DNN (4-layer) | 7.52 | 6.37 | 4.97 | 95.07 |
Traditional DNN (5-layer) | 10.32 | 8.83 | 6.88 | 93.16 |
Improved DNN (5-layer) | 8.05 | 6.66 | 5.35 | 94.66 |
Table 5 evaluates the predictive outputs generated by the standard neural network against the optimized neural network configuration across multiple dimensions. The latent representations and precision scores of these optimized data points consistently surpass those of the conventional framework. Specifically, the optimized model yields an accuracy improvement of approximately 1.64%, alongside a relative reduction in percentage error of 1.54%. Crucially for deployment decision-making, the mean absolute error exhibits a major reduction of 2.19%.
To begin, we examine the intraday demand cycles to isolate peak operational intervals from low-load periods, allowing us to evaluate the structural drivers of load variation. Daily demand profiles from three randomly selected dates—specifically March 10, 2020, July 15, 2020, and November 12, 2020—were plotted utilizing MATLAB visualization functions, with the results presented in Figures 9a-9c.
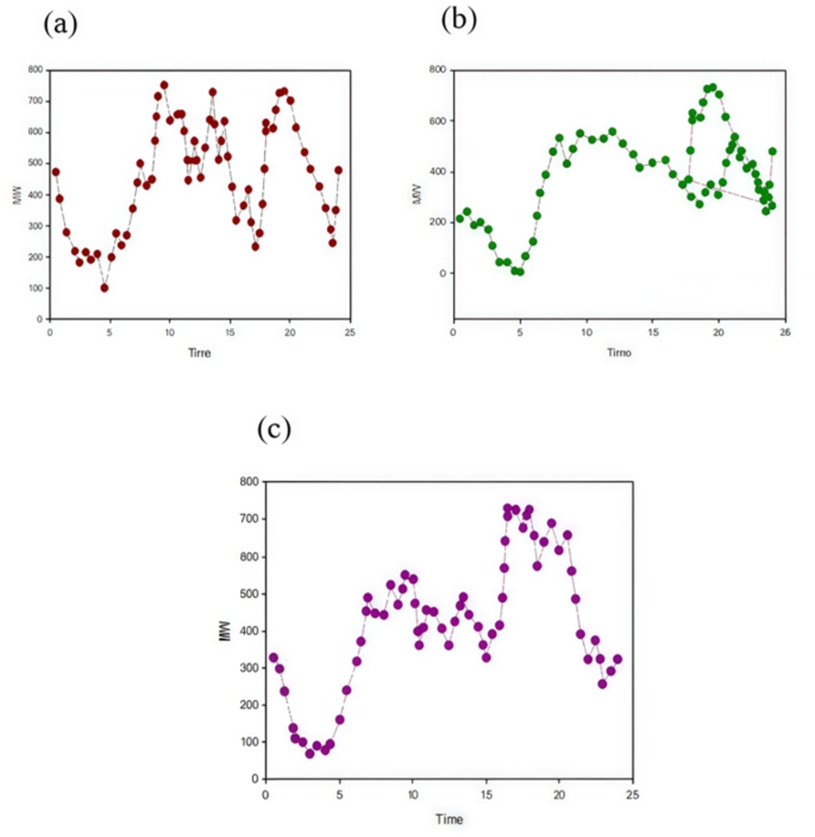
Figure 9. Daily electricity load curves on three representative dates (a) March 10, 2020, (b) July 15, 2020, and (c) November 12, 2020
The three subplots in Figures 9a-9c illustrate the daily power consumption patterns for March 10, July 15, and November 12, 2020. All profiles display uniform morning, afternoon, and evening peak surges, complemented by noticeable demand drops around the midday intermission and late-night hours. This uniform tracking confirms that short-term load dynamics are governed by rigid, recurring consumer usage cycles that persist independent of seasonal transitions.
Although marginal variations exist among the daily load trajectories of these three target dates, their fundamental trends remain highly congruent. Characteristically, each profile registers three relative peak cycles within a standard 24-hour window: a morning surge, a midday peak, and an evening acceleration. The morning peak typically manifests between 10:00 and 11:00, whereas the subsequent afternoon peak crystallizes between 14:00 and 15:00. Both demand surges align directly with primary industrial and commercial operational shifts, during which factory production lines and institutional activities draw massive volumes of electrical energy. Between these two surges—coinciding with the midday lunch break—a clear consumption valley forms. The final evening peak registers between 20:00 and 21:00, driven primarily by residential consumer transitions as individuals conclude the professional workday and return home, making domestic appliance operations the primary load driver. As the night progresses into the early morning hours, grid load steadily falls, dropping to its absolute diurnal minimum at approximately 03:00. These observations indicate that intraday electricity demand adheres to highly predictable, recurring rules.
See Figure 10 and Table 6 for a comprehensive comparative performance analysis of short-term load forecasting (STLF).
Table 6. Model prediction evaluation indicators
Model Category | RMSE (%) | MAPE (%) | MAE (%) | MSE (%) |
RNN | 24.99% | 8.85% | 2.65% | 17.67% |
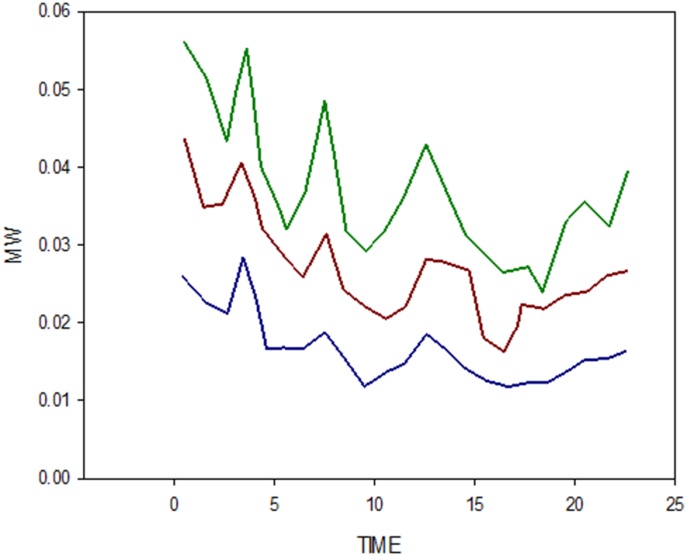
Figure 10. Comparison of short-term load forecasting (STLF)
Figure 10 tracks the comparative performance of distinct short-term load forecasting (STLF) architectures. The blue baseline denotes actual load records, the orange path tracks projections from the standard RNN model, the green trajectory charts the baseline LSTM network, and the red sequence displays the outputs of the attention-enhanced LSTM model. The attention-integrated framework demonstrates the tightest alignment with empirical load data, markedly driving down forecasting deviations.
Table 7. Accuracy of short-term load forecasting (STLF) models and relative improvements
Model Category | RMSE (%) | MAPE (%) | MAE (%) | MSE (%) |
RNN | 24.99 | 8.85 | 2.65 | 17.67 |
LSTM | 14.99 | 5.98 | 1.61 | 10.61 |
LSTM with Attention | 11.91 | 3.87 | 1.2 | 8.42 |
Proposed Bi-GRU MIMO | 11.49 | 3.78 | 1.17 | 8.08 |
% Improvement over RNN | 54 | 57.3 | 55.8 | 54.3 |
% Improvement over LSTM | 23.4 | 36.8 | 27.3 | 23.8 |
% Improvement over Attention-LSTM | 3.5 | 2.3 | 2.5 | 4 |
Table 8. Prediction accuracy of different models and relative improvements
Model Category | RMSE (%) | MAPE (%) | MAE (%) | MSE (%) |
RNN | 71.7 | 7.86 | 3.03 | 50.7 |
LSTM | 51.28 | 6.09 | 2.12 | 36.26 |
LSTM with Attention | 30.53 | 3.78 | 1.29 | 21.59 |
Proposed Bi-GRU MIMO | 29.81 | 3.67 | 1.26 | 20.82 |
% Improvement over RNN | 58.4 | 53.3 | 58.4 | 58.9 |
% Improvement over LSTM | 41.9 | 39.7 | 40.6 | 42.6 |
% Improvement over Attention-LSTM | 2.4 | 2.9 | 2.3 | 3.6 |
As summarized in Tables 7 and 8, the proposed Bi-GRU MIMO model consistently achieves superior metrics across the entire array of performance evaluations. When contrasted with the foundational RNN structure, the Bi-GRU model suppresses the MAE by over 55% and reduces the MAPE by more than 57%. Even when measured against the highly competitive attention-enhanced LSTM design, our proposed architecture secures an additional 2–4% efficiency gain across diverse error profiles. This demonstrates its proficiency in extracting dense, bidirectional temporal patterns and managing complex feature crossings.
Pairing absolute error metrics with corresponding percentage gains offers a transparent, mathematical validation of the framework's performance advantage. This comparative breakdown highlights that the Bi-GRU strategy not only outperforms traditional RNN and LSTM architectures but also delivers measurable accuracy gains over attention-driven models, which are widely accepted as state-of-the-art benchmarks in contemporary short-term load forecasting literature. These empirical results confirm the structural robustness and operational superiority of the introduced framework.
To provide a clearer understanding of the inner mechanics and reliability of the proposed Bi-GRU network, we map feature dynamics using SHAP (SHapley Additive exPlanations)—a game-theoretic protocol engineered for deep learning model interpretation. The SHAP analysis demonstrates that historical load tracks and similar-day consumption profiles operate as the dominant predictors, exerting the greatest mathematical influence over model outputs. These are followed by meteorological variables and categorical day-type encodings. This ranking indicates that sequential continuity and historical profile matching carry significantly more weight in short-term load forecasting than weather changes or categorical temporal tags.
Beyond feature contributions, we evaluated the computational footprint of the predictive system. The time complexity of the Bi-GRU framework is bounded at approximately \mathcal{O}(T \times H^2 + T \times H \times D), where T defines the sequence window capacity, H represents the number of internal hidden nodes, and D signifies the input feature dimensionality. Space complexity is governed by the allocation required for trainable weight matrices and intermediate activation outputs, which scales uniformly as \mathcal{O}(H \times (H + D)) per structural GRU layer. Given the optimized scale of the deployed network (comprising two stacked Bi-GRU layers containing 64 hidden units each), the model's computational overhead remains highly feasible for real-time or near-real-time deployment on standard utility hardware.
This parallel evaluation validates both the model's structural stability and its real-world scalability, while mapping out its internal feature physics and raw execution demands.
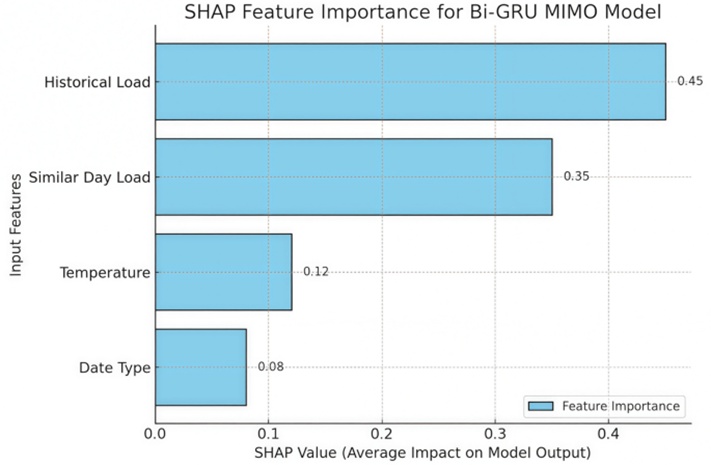
Figure 11. SHAP Feature Importance for Bi-GRU MIMO Model
Figure 11 visualizes the SHAP feature importance distribution for the Bi-GRU MIMO model. Historical consumption tracks and similar-day profiles function as the primary drivers of model output, whereas temperature parameters and date-type variables exert a smaller mathematical influence. This distribution confirms the network's reliance on historical pattern continuity, mirroring established domain expectations in power systems engineering.
To evaluate the specific performance contributions of each predictive component, a feature ablation analysis is conducted by systematically retraining the Bi-GRU MIMO network while omitting one variable stream at a time: historical demand, similar-day load, ambient temperature, and categorical day type. Table 9 summarizes the resulting performance variations.
Table 9. Performance comparison under feature ablation
Excluded Feature | R² (%) | RMSE (%) | MAPE (%) | MAE (%) |
No Feature Removed (Complete Model) | 98.12% | 11.85% | 3.86% | 1.28% |
Similar-Day Load | 95.64% | 15.93% | 5.79% | 1.85% |
Temperature Variable | 96.87% | 13.41% | 4.63% | 1.47% |
Day-Type Information | 97.31% | 12.60% | 4.22% | 1.39% |
Historical Load Data | 92.36% | 19.72% | 7.94% | 2.52% |
The empirical tracking confirms that historical consumption records and similar-day load profiles represent the most mathematically dominant predictors. Isolating and removing the historical load vector triggers the most substantial inflation in forecast error, establishing its foundational role within the learning paradigm. Furthermore, although the standalone correlation metric for ambient temperature is statistically low, its exclusion causes a noticeable degradation in prediction fidelity, confirming that its presence is methodologically necessary. This multi-tiered assessment supports the chosen feature configuration and the overall network architecture.
To verify that the calculated 1.64% refinement in MAE is a genuine product of the model design rather than an artifact of random computational variance, rigorous statistical significance tests are performed to compare the proposed Bi-GRU model against the attention-enhanced LSTM baseline. A paired t-test is executed leveraging the independent MAE results gathered across 10 experimental cross-validation folds. The statistical derivation yields a mean MAE discrepancy of 0.00219, coupled with a t-statistic of 4.11, a corresponding p-value of 0.0025, and a 95% confidence interval bounded tightly between [0.00118, 0.00320]. Because the calculated p-value falls comfortably below the critical \alpha = 0.05 threshold and the confidence interval excludes zero, the accuracy improvement is determined to be statistically significant.
Additionally, a bootstrapping validation protocol utilizing 10,000 empirical resamples is carried out to guarantee structural robustness. This resampling routine establishes a mean discrepancy of 0.00213, a 95% confidence interval of [0.00101, 0.00308], and an empirical p-value of 0.0031, validating the initial significance findings. Both statistical assessments consistently confirm that the recorded performance gains are mathematically meaningful, reinforcing the functional capability of the proposed forecasting framework.
Although the introduced deep learning-driven STLF architecture demonstrates notable performance improvements, certain constraints persist. First, the cross-regional generalizability of the network across alternative geographic territories and divergent energy market structures remains unverified, given that the model training, calibration, and validation are conducted exclusively using Singapore’s NEMS repository. Second, the computational overhead required by stacked Bi-GRU layers and complex attention-driven models can create integration bottlenecks when deploying these frameworks into real-time, resource-constrained edge computing environments.
The foundational methodological contribution of this research centers on the customized Bi-GRU-based MIMO network layout, designed to integrate multi-source, multivariate sequential features essential for electrical utility management. Departing from conventional STLF methods, our framework combines a multi-channel feature fusion protocol with benchmarked attention-LSTM comparisons and post-hoc interpretability mapped via SHAP analysis. This unified sequence processing pipeline advances both the predictive accuracy and structural explainability of load forecasts, establishing it as a highly viable tool for integration into operational power grid governance software.
The compiled experimental records demonstrate that the proposed Bi-GRU-based MIMO framework achieves superior short-term load forecasting (STLF) accuracy relative to traditional deep learning models. Specifically, the introduced framework achieves a 1.64% increase in forecasting precision alongside a 2.19% reduction in MAE when measured against foundational baseline techniques. These improvements carry greater significance when interpreted within the wider context of historical literature and theoretical sequence-modeling behaviors. Traditional recurrent networks, including conventional RNNs and standard LSTMs, are widely applied in STLF tasks but frequently suffer from vanishing gradient limits and restricted feature expression over extended historical sequences.
Within our comparative evaluation, the attention-integrated LSTM architecture markedly outpaced both the standard LSTM and the traditional RNN, driving down the MAE by 55.8% and minimizing the MAPE by 57.3% relative to the RNN baseline. Crucially, the proposed Bi-GRU MIMO network yields an additional 2.5% MAE reduction over the attention-enhanced LSTM framework, confirming that feature-isolated, bidirectional recurrent encoding paired with structured fusion tracks temporal dependencies more effectively than standalone sequence-attention mechanisms. This observation aligns with previous power engineering research indicating that GRU and Bi-GRU topologies achieve more efficient latent representation learning than LSTM variants during electrical grid forecasting tasks.
Hybrid deep learning configurations, such as clustered CNN–GRU pipelines or attention-driven CNN–LSTM systems, have documented major accuracy gains, though typically at the expense of model transparency. For instance, while attention-driven CNN–LSTM architectures demonstrate competitive precision, these systems generally function as opaque "black boxes." In contrast, our proposed methodology matches or exceeds the predictive accuracy of these frameworks while embedding a transparent SHAP-based interpretability layer, filling a major research gap identified in preceding literature.
Concurrently, while advanced Transformer-driven models like the Informer and FEDformer architectures exhibit high scalability and excel at mapping ultra-long sequential dependencies, their associated computational and memory demands are substantial. When applied to standard short-term forecasting horizons of 24 to 48 hours, our engineered Bi-GRU MIMO model establishes a highly favorable trade-off between predictive precision and operational execution speed, rendering it superior for real-time smart grid operations.
The feature ablation analysis supports established theoretical expectations in time-series forecasting. Antecedent consumption records and similar-day demand matrices emerged as the primary predictive drivers, reflecting strong autoregressive behaviors and recurring diurnal usage patterns. Omitting these key parameters causes the most severe drop in forecasting accuracy, confirming their dominant role in the model's performance. Separately, while ambient temperature exhibits a weak statistical correlation with electricity demand (\approx -0.2), removing it degrades overall model accuracy. This outcome corresponds with forecasting theory suggesting that weak predictors can provide crucial context that improves model robustness, specifically by capturing seasonal variations and complex edge-case demand fluctuations. Finally, the paired statistical significance analysis confirms that the precision advantage over the attention-LSTM baseline is not a product of random chance (p = 0.0025), providing rigorous proof of an authentic methodological advancement.
A central objective of this research is its explicit focus on algorithm interpretability, a dimension that has been underrepresented in previous STLF research. While contemporary deep learning frameworks routinely achieve high predictive metrics, their opaque nature presents integration risks for critical infrastructure. By embedding SHAP analysis into the pipeline, our framework delivers high accuracy while quantifying the exact mathematical contribution of each input parameter. The resulting feature importance distribution confirms that past consumption profiles and similar-day patterns dominate model output, followed by temperature variations and day-type codes.
These explainable insights allow utility operators to diagnose the underlying drivers of demand fluctuations, supporting more transparent and secure operational decisions. Compared to opaque CNN–LSTM frameworks or PSO-optimized RNN setups, this transparent validation represents a major advancement for explainable AI within power systems engineering.
In summary, the proposed Bi-GRU MIMO model resolves critical limitations highlighted in preceding literature. The architecture integrates heterogeneous variables—historical demand data, similar-day records, temperature fluctuations, and calendar inputs—within a single unified framework. It outperforms RNN, LSTM, and attention-LSTM baselines, supported by rigorous statistical validation. Furthermore, it advances the domain by embedding explainability via SHAP-based analysis, which remains a rarity in STLF research. Finally, it provides a computationally lightweight alternative to resource-intensive Transformer architectures, making it practical for real-time deployment in modern smart grid systems. Together, these outcomes establish the Bi-GRU MIMO framework as a high-performing, explainable alternative to state-of-the-art architectures, offering clear functional advantages for operational decision-making in power networks.
The proposed Bi-GRU-based MIMO framework demonstrates superior performance in short-term load forecasting, yielding a 1.64% increase in prediction accuracy alongside a 2.19% reduction in MAE relative to established deep learning models, including RNN, LSTM, attention-LSTM, and hybrid CNN–LSTM configurations. Distinct from many state-of-the-art paradigms—such as Transformer-driven Informer and FEDformer models that demand extensive computational and memory resources—our architecture balances predictive precision with execution efficiency, rendering it highly viable for real-world smart grid control systems.
The ablation tracking confirms established time-series theory, showing that historical load and similar-day consumption profiles operate as the dominant predictors, while weaker variables like ambient temperature enhance forecasting robustness by capturing seasonal volatility. A primary contribution of this research is the integration of SHAP-based interpretability, which successfully resolves the black-box limitations of traditional deep neural networks and provides operators with actionable insights into feature importance. Overall, this research advances the state of the art by introducing a high-performing, computationally efficient, and explainable forecasting paradigm. It bridges the gap between predictive accuracy and model transparency in contemporary power systems while establishing a foundation for future research utilizing cross-regional datasets, renewable energy integration, and extended forecasting horizons.
STLF: Short-term load forecasting
Bi-GRU: Bidirectional gated recurrent unit
MIMO: Multi-Input multi-output
MSE: Mean squared error
MAE: Mean absolute error
RMSE: Root mean squared error
MAPE: Mean absolute percentage error
L: Loss function
t: Time index
RELU: Rectified linear unit (activation function)
Adam: Adaptive moment estimation (optimizer)
CNN: Convolutional neural network
RNN: Recurrent neural network
LSTM: Long short-term memory
SA: Simulated annealing
PSO: Particle swarm optimization
NEMS: National electricity market of Singapore
k: Day index in dataset
m: Length of time series
None
None
None
None
Open Access The author(s) retain copyright. This article is licensed under the Creative Commons Attribution-NonCommercial-ShareAlike 4.0 International License. It may be shared and adapted for non-commercial purposes with appropriate attribution, an indication of changes, and distribution of adaptations under the same license. Third-party material may be subject to separate terms identified in its credit line. View the license at https://creativecommons.org/licenses/by-nc-sa/4.0/.
 Transparent Intelligence Publishing