The intricate and heterogeneous nature introduced by the decentralized architecture of the modern electric information collection system has increased the difficulty of establishing verification index systems and quality appraisal frameworks. Furthermore, discrepancies between distinct components complicate the realization of impartial and scientifically sound validation. To address these challenges, an integrated construction quality evaluation framework grounded in multi-scenario comprehensive weighted assessments was developed by exploiting graph neural networks and siamese networks. Initially, a graph neural network was formulated utilizing terminal data from the regional branches' electricity utilization information collection system alongside its link topological framework. This network was subsequently implemented at the headquarters level to directly capture terminal information and produce mirrored network inputs from the regional branch data, facilitating the real-time acquisition of diverse system performance metrics. Ultimately, the degree of correspondence between the headquarters and regional branch datasets was computed via siamese networks to derive precision compensation weights for validating and analyzing various parameters, thereby yielding comprehensive weighted quality appraisal indicators for the next-generation electric information collection systems at the branch level. Three distinct service types—namely, power data acquisition, load forecasting, and task scheduling—served as the experimental environments. The empirical findings demonstrated that the multidimensional comprehensive weighted quality appraisal, augmented by the accuracy compensation derived from the siamese network, achieved business construction quality evaluation ratings of 97.92%, 95.95%, and 99.96% within the branch system. These metrics closely approximate the quality ratings obtained through manual assessment, confirming that this methodology can reliably validate the construction quality of modern systems implemented across branches.
Driven by the accelerated convergence of the energy revolution and digital transformation, the progression of electricity market restructuring [1], and the tightening balance between supply and demand within the electrical sector, novel difficulties and criteria have materialized. Consequently, there is an escalating requirement for high-frequency, high-fidelity data streams from electricity information collection infrastructures, along with stricter benchmarks for the execution reliability of system control commands, instantaneous load surveillance, precise identification of consumer power disruptions, and power billing and settlement operations [2]. Conventional, monolithically structured electricity information gathering systems can no longer satisfy contemporary operational evolution demands, necessitating the transition toward an entirely re-engineered architectural paradigm. Utilizing this newly established electricity information collection network, the precise detection of microscopic operational application variances is accomplished [3]. Cross-cloud dynamic device integration enables wide-area synchronized testing and verification, facilitating the creation of an evaluation index framework that accommodates comprehensive weighted computations across multiple operational scenarios, thereby guaranteeing that the platform functions in a standardized, dependable, and high-quality manner. The primary innovations of this study are outlined below:
(1) In light of the structural complexity and architectural heterogeneity inherent in the decentralized frameworks of modern electric information collection infrastructures, this study develops a graph neural network model tailored for branch-level electricity information systems based on terminal analytics and link topologies. It models the various internal functional components and terminal units as nodes, while representing the directional data transmission pathways as edges. The algorithm yields the construction quality verification probability for each discrete node, effectively capturing the spatial interdependencies among the distinct functional units of the network. Concurrently, by utilizing the sequential monitoring data from each node as input variables, the framework enables the persistent tracking of construction quality across branch systems over time, preventing the obsolescence of assessment data.
(2) Reflecting the structural discrepancies in the deployment of next-generation electric information collection architectures across different regional provinces, a frequent strategy involves leveraging headquarters-side mirror modeling to assess branch-level installations. Nevertheless, variances in operational environments induce discrepancies between actual running telemetry and idealized baseline settings, significantly degrading the fidelity of branch construction quality diagnoses. To attain instantaneous, equitable verification and appraisal of branch installation quality, this paper designs both direct deployment configurations and mirrored frameworks predicated on the graph neural network architecture of the branch-level modern electric information collection networks. These parallel configurations function as a Siamese network validation and assessment architecture designed to quantify structural alignment and differences between the headquarters and branch implementations, thereby enhancing the precision of branch construction quality evaluations.
(3) Recognizing that conventional construction quality metrics frequently suffer from deficiencies in impartiality and interpretability, this manuscript introduces a multi-scenario weighted evaluation technique founded on explicit operational execution performance indicators. Upon gathering evaluation telemetry reflecting the completion status of diverse operations, and incorporating the Siamese network validation and assessment architectures, the precision compensation weights connecting the headquarters and branch systems are computed to generate the multi-scenario weighted performance ratings of the infrastructures. This methodology guarantees that the analytical conclusions are increasingly dependable and authoritative.
Owing to the inherent capability of graph neural networks to distill salient features from graph-structured datasets, and given that electricity information collection architectures within the power sector possess a corresponding topological framework, graph neural networks have found broad utility across electricity-related domains [4, 5]. Deng et al. [6] introduced a graph deviation network that exploits topological frameworks to discern inter-relationships among sensor nodes, thereby identifying and interpreting anomalies in behavioral patterns while concurrently uncovering irregularities within sensor grids. Zhao et al. [7] leveraged graph neural networks to interpret intricate topological setups for capturing spatial connections, applying this methodology to traffic forecasting problems. In reference [8], graph attention neural networks were deployed to optimize the precision of transient stability evaluations within electrical grids by embedding structural characteristics of the power network topology.
Siamese networks [9] are comprised of a pair of identical neural architectures functioning as twin subnetworks that share identical weights (encompassing both parameters and structural configuration) [10]. Wang et al. [11] applied Siamese networks to resolve difficulties associated with bearing degradation diagnostics. In their approach, a neural network was initially optimized to capture distinctive model parameters, which were subsequently migrated to the Siamese framework. The network was then retrained using holistic datasets, capitalizing on the noise-rejection strengths characteristic of Siamese architectures. To optimize fault diagnosis capabilities under restricted data conditions, Zhao et al. [12] recommended adapting deep neural network structures into a Siamese network paradigm. By distilling feature vectors from datasets through a weight-sharing backbone network, bearing fault classification was successfully executed. Utilizing the foundational stability of the basic Siamese setup, Chen et al. [13] introduced the Simsiam model, expanding the capabilities of Siamese frameworks and establishing novel trajectories for this structural paradigm.
Within the electrical engineering discipline, the exploration and deployment of digital twin methodologies are demonstrating a consistent upward trajectory year-on-year, progressively integrating into diverse segments of the power industry. Reference [14] outlined a systematic strategy for the design and installation of intelligent power production infrastructures via digital twin frameworks, defining digital twins within the context of smart power generation. Targeting information security vulnerabilities within power grids, reference [15] presented a digital twin model anchored in Cyber-Physical Internet of Things (IoT) systems. This architecture interfaces directly with control loops to counteract coordinated false data injection efforts and cyber intrusions, preserving the operational integrity of control frameworks.
Building upon the aforementioned scientific precedents, this study utilizes decentralized architectural datasets derived from modern electric information collection infrastructures [16-18]. This manuscript articulates an integrated construction quality appraisal framework grounded in multi-scenario weighted analysis by synthesizing graph neural networks and Siamese network architectures.
The decentralized architecture characteristic of modern electric information collection networks is defined by its inherent complexity and heterogeneity, which introduces substantial difficulties in formulating validation index systems and creating structural quality appraisal frameworks. Concurrently, the presence of distinct, non-uniform components impedes the realization of objective and standardized verification. To resolve these operational barriers, this study establishes a two-tiered, integrated construction quality appraisal framework grounded in multi-scenario comprehensive weighted analysis, leveraging both graph neural networks and Siamese networks.
As illustrated in Figure 1, historical operational telemetry from the decentralized modern electric information collection systems at the regional branch level is compiled initially to construct a foundational data sample repository for the graph neural network. This repository comprises sequential time-series tracking data generated by segmenting network node performance across diverse temporal intervals. Subsequently, this sequential monitoring data extracted from historical records is converted into a graph-compatible format to construct the specialized graph neural network training dataset. This formatted dataset is then routed into a graph attention neural network for iterative training, which yields the finalized graph neural network configuration.
Following this, the trained graph neural network architecture modeled for the branch-level systems is deployed directly within the central headquarters environment, while a corresponding mirrored simulation model of the branch-level system is established inside the headquarters testing environment. The directly implemented framework receives live, real-time sequential monitoring streams originating from the various terminal units and junction nodes of the actual branch infrastructure. Conversely, the mirrored simulation framework receives simulated terminal data representing the data acquisition layer of the branch networks.
Ultimately, the degree of correspondence between the operational executions at the headquarters level and the branch level is quantified via Siamese networks. Utilizing comprehensive multi-scenario operational weighting, the overall construction quality of the branch-level modern electric information collection infrastructure is rigorously evaluated. The resulting similarity index serves as an accuracy compensation weight to calibrate the mirrored simulation modeling against the direct deployment architecture. This optimization effectively minimizes operational discrepancies between the simulated testing environment and the actual, live production environments across the various nodes of the branch-level electric information collection networks.
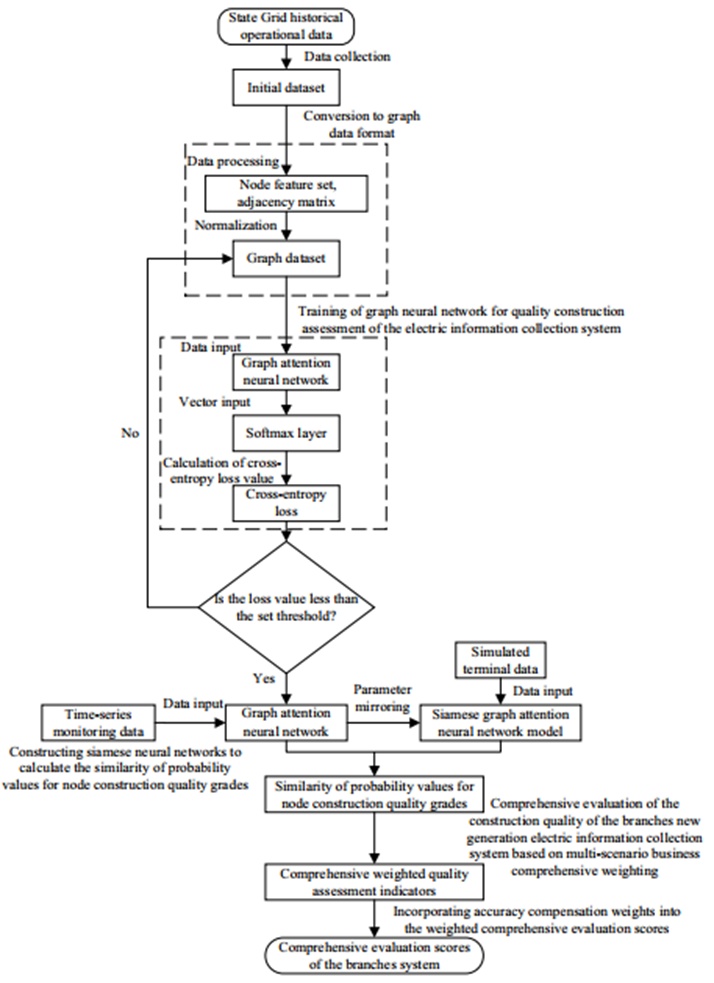
Figure 1. Overall flow chart
The historical, dynamic operational telemetry generated by the electric information collection network is converted into a graph data framework to assemble the target dataset for the graph neural network. This data encompasses sequential time-series tracking matrices derived by partitioning the telemetry streams of the individual nodes within the graph network. Every internal functional component and terminal unit within the infrastructure is conceptualized as a discrete node, which enables the formulation of individual node feature matrices . Concurrently, the internal data transmission pathways are conceptualized as directional edges to formulate corresponding adjacency matrices , thereby establishing the comprehensive graph neural network sample repository. Within this formulation, n defines the total quantity of nodes, f signifies the dimensionality of the specific node monitoring metrics, and m represents the count of connecting edges associated with that node. The architecture of the node feature matrix is defined through the following approach:
Assuming that a given node data sequence attribute () transitions into a finalized node feature (() across a span of d discrete time intervals (, , …, ), the evolutionary trajectory of () starting from () can be mathematically formulated as:
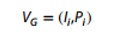 (1)
Within this expression, denotes the aggregated set of the d sequential time-interval feature parameters recorded for node i, such that = {, , …, }.
The structural transition of the data sequence features during any individual time interval (1 ≤ i ≤ n) incorporates four core phases: the baseline input (), the categorized sequence structural forms (), the conditional sequence logical operations (), and the resulting output ().
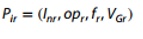 (2)
Where the parameters are defined as follows:
= (, , …, ), , ) defines the primary input, where represents the specific feature sequence data points for the i-th node belonging to input I extracted across d total time intervals, while and designate the precise initialization and termination timestamps of that input.
= (, , ) defines the categorized sequence structural forms, where indicates the designation of the various sequence types, while and represent the initialization and termination timestamps of those specific sequence classifications.
: → represents the sequence logical processing function mapping the input parameters to the output state, which chronologically joins the diverse sequence classifications relative to each sequential time interval.
= (, ,, …, ), , ) represents the output state, where , ,, …, distinct data sequence properties belonging to the output, while and designate the initialization and termination timestamps of the generated output.
Through the execution of this operational sequence, the final node sequence feature () is successfully isolated. In the case of stationary or static data, the underlying data values are directly appended to the termination point of the dynamic data sequence matrix to present an unrestricted, holistic representation of the node information. The structural adjacency matrix () is constructed directly from the underlying physical and logical topological links that govern the data transmission pathways of the electric power information collection infrastructure.
The individual node features () isolated during the preceding processing operations are subsequently normalized utilizing the Z-score standardization methodology:
 (3)
In Eq. 3, signifies the arithmetic mean calculated across all individual metrics of the node feature () within a specific dimension, while \sigma represents the calculated statistical variance of those node feature () metrics within that identical dimension. When unified with the adjacency matrix reflecting the link topology, this yields the standardized graph data matrix necessary to model the data transmission pathways of the electric power information collection infrastructure.
The modern electric information collection network is constructed from an array of interconnected functional sub-components, assembling a architecture that conforms to a prototypical graph topology. The operational optimization framework of the electric power information collection graph architecture, driven by graph attention neural networks, is illustrated in Figure 2. Structured graph data serves as the baseline input, whereby the individual feature arrays of each node contained within the graph matrix are routed into the graph attention layer. Every discrete node aggregates the feature attributes of its immediate neighboring nodes, guided by the adjacency matrix that mirrors the physical topology of the data transmission pathways within the electric power information collection infrastructure.
By iteratively adapting these node profiles to isolate the spatial layout attributes of the system’s diverse data parameters, the intermediate matrices incorporating the spatial distribution traits of the electric power information collection network are flattened into single-dimensional vectors. Passing through a fully connected dense layer and a Softmax mathematical operator, the system generates the probability matrices defining the construction quality classifications for every node, thereby confirming the structural quality ranking of that specific node. These node construction quality rankings are defined based on operational execution completion metrics, which encompass both response latency categories and overall operational execution success rates. The framework organizes the node construction quality rankings into four distinct tiers—namely, level one, level two, level three, and level four—where level one represents optimal construction quality and level four indicates the lowest quality threshold.
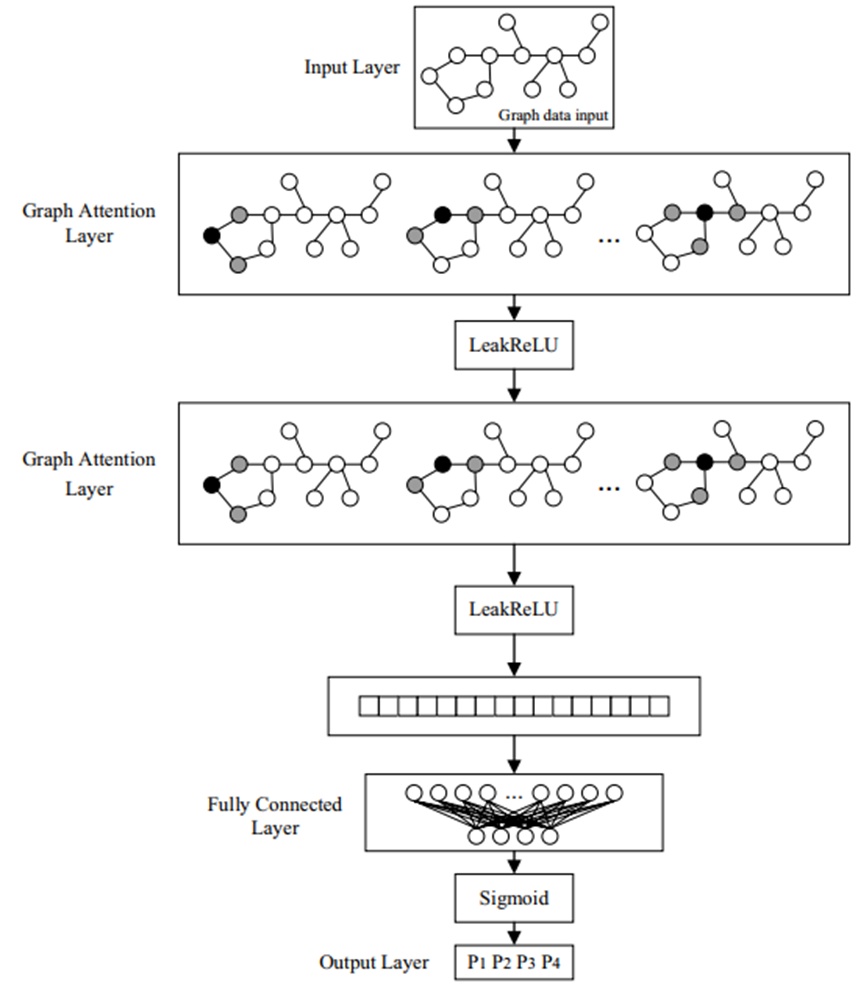
Figure 2. Graph model training structure
The node feature vector (H) is systematically routed through two consecutive graph attention layers. Within each graph attention layer, a linear mathematical transformation is optimized to map the incoming input feature vectors into a higher-order feature space. Throughout this execution phase, a shared parameter weight matrix (W) is applied initially to carry out the linear transformation on the individual features of each node. Subsequently, the relative attention coefficients linking a target node to its respective adjacent nodes are determined through a localized attention framework, as mathematically formulated in Eq. 4:
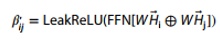 (4)
To embed the heterogeneous, multi-layered features of adjacent nodes into the target node profile, a multi-head attention routine is deployed to establish the relative weight distributions for each neighboring node. Initially, K independent parameter weight matrices (W) are established to determine the neighbor node influence weights from multiple distinct analytical viewpoints. The localized attention routines run concurrently and independently across each perspective, as structurally represented in Figure 3. To balance and contrast the relative significance of separate nodes using these calculated attention weights, a Softmax normalization function is applied to standardize the attention coefficients across all neighboring nodes connected to the target node. The specific attention weight distributions for each adjacent node are determined in accordance with Eq. 5:
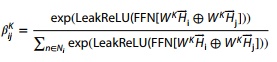 (5)
Within this expression, designates the collection of immediate neighboring nodes linked to the target node, while denotes the K-th parameter weight matrix selected from the multiple initialized node parameter configurations. In this formulation, quantifies the structural importance of the node features of a neighboring node (j) relative to the target node (i), while FFN denotes a feed-forward neural network structure. The mathematical operator ⊕ specifies a vector concatenation process, and LeakReLU(·) represents a non-linear mathematical activation function used to optimize the non-linear processing capacity of the framework. This activation function is defined according to Eq. 6:
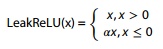 (6)
Within this definition, the intermediate feature vector derived from the linear mathematical transformation executed by the feed-forward network in Eq. 5 is designated as x, and the scaling parameter α is defined as 0.2.
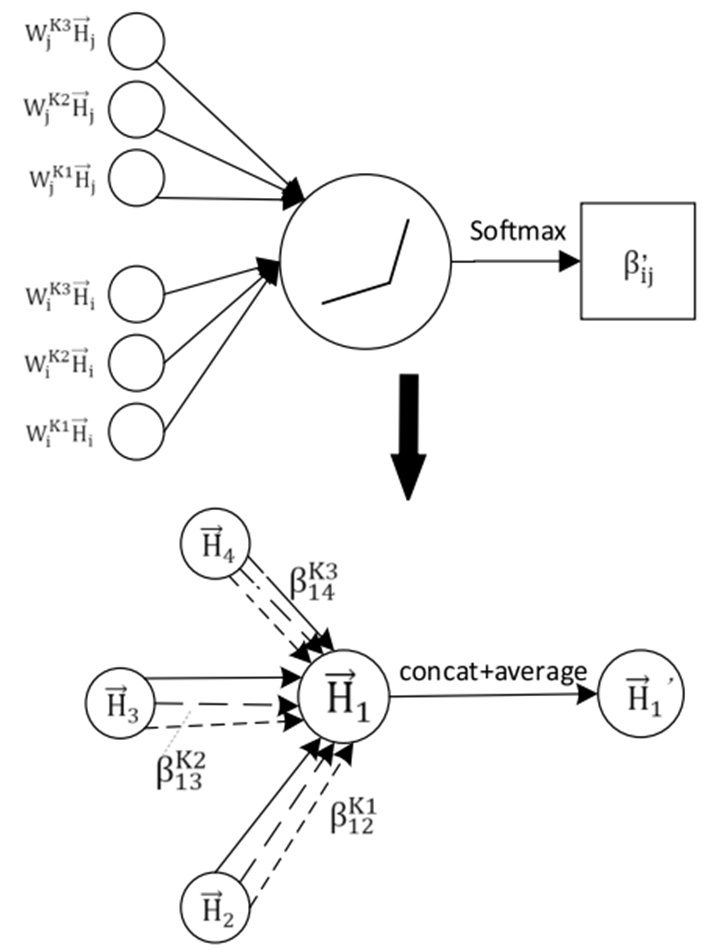
Figure 3. Graph Multi-Head Attention Mechanism (with 3 heads)
Based on the magnitude of the calculated weights, the feature attributes of adjacent vertices are assimilated into the target node at varying intensities, thereby executing the state modification of the target node's features. This structural update is mathematically formalized in Eq. 7:
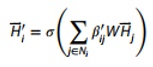 (7)
where (.) denotes the non-linear activation function eLU, which is mathematically operationalized within the graph attention neural architecture as follows:
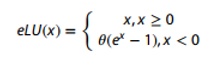 (8)
Within this specific graph attention neural architecture, the scaling parameter \alpha established in the equation is defined as 1. The specific target node feature vector that aggregates neighboring structural data conditioned on the weights in Eq. 7 is represented as x. The graph-based multi-head attention routine aggregates the adjusted node characteristics derived from each concurrent attention loop via concatenation, subsequently applying an averaging operator to yield the final updated target node feature profiles, as specified in Eq. 9:
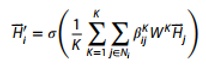 (9)
Following the optimization of the target node's feature configuration, the existing feature vector is projected into a one-dimensional space and routed through a fully connected layer to execute dimensionality reduction. This compressed vector is subsequently mapped into a Softmax mathematical layer to yield the probability matrix (P) indicating the precise construction quality classification of the designated node, as defined in Eq. 10:
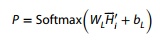 (10)
where signifies the weight parameter matrix assigned to the fully connected layer, and bL represents the corresponding structural bias matrix of that identical layer.
By evaluating the generated probability matrices of the target node construction quality against the empirically defined baseline quality probabilities for each respective node, the cross-entropy loss metric is derived. The internal parameters of the graph attention neural network are iteratively modified through backpropagation algorithms. By enforcing a strict ceiling threshold for the cross-entropy loss, the operational parameters are frozen once the error falls beneath this specified limit, ultimately producing the finalized graph neural network configuration specialized for appraising the installation quality of next-generation electric information collection architectures within regional branches.
The architectural quality classification of the infrastructure modeled via the graph attention neural network is established. This neural network is capable of externalizing hidden feature vectors representing the diverse criteria of the system installation, which ultimately dictate the structural configuration standard of the infrastructure. The graph neural network model designed around the branch-level next-generation electric information collection network is executed at the central headquarters level to serve as the direct deployment benchmark. Concurrently, the identical graph neural network model mirroring the branch-level system is instantiated as a simulation model within the central headquarters' virtualized testing environment.
The direct deployment benchmark processes actual terminal telemetry and sequential tracking metrics captured from each individual branch node, whereas the simulated model receives synthetic terminal data scaled to replicate the data throughput magnitudes inherently collected by the physical branch network terminals. Utilizing both the direct deployment framework and the mirrored simulation framework, a Siamese network validation architecture is established to compute the similarity probability metrics regarding the construction quality classifications of the individual nodes. The underlying topology of this Siamese network [19] is illustrated in Figure 4.
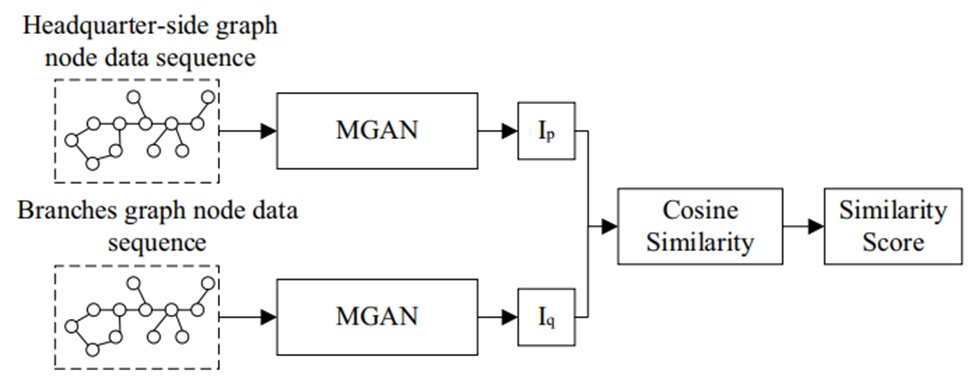
Figure 4. System Indicator Similarity Measurement Model Based on Siamese Networks
The node data sequences derived respectively from the central headquarters and the regional branch networks are channeled into a pair of identical graph attention neural architectures, wherein both feature isolation sub-networks possess completely uniform structural layouts and parameter weights. These incoming data sequences are represented as = {, , ..., } and = {, , ..., } denotes the reference data sequence originating from the headquarters environment, and indicates the operational data sequence recorded from the regional branch infrastructure. Discrepancies may exist between these two data sequences regarding temporal duration, tracking telemetry variation, or anomalies induced by human intervention.
The two identical deep neural networks map these inputs into fixed-dimensional vectors ∈ and ∈ . A cosine similarity formulation is subsequently utilized to quantify the degree of alignment between the two generated feature vectors, thereby verifying the underlying metrics of the system installation, as expressed in Eq. 11:
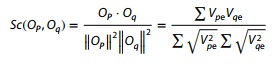 (11)
Where and designate the specific sequence elements contained within and respectively.
Utilizing a multi-scenario operational comprehensive weighted appraisal framework, the installation quality of the next-generation electric information collection infrastructure at the branch level undergoes a systemic evaluation. This analytical procedure entails quantifying the execution promptness and operational integrity of tasks processed by each node across distinct business use cases, evaluating varied system performance indexes relative to task execution completion parameters. Weight metrics generated via the Siamese network are applied to execute a weighted data fusion of the aforementioned performance indexes, constructing a comprehensive weighted quality appraisal metric for the branch-level modern electric information collection infrastructure.
The layout of the comprehensive weighted quality appraisal model tailored for the branch-level next-generation electric information collection networks is illustrated in Figure 5. This analytical framework ingests the data streams from the central headquarters alongside the data streams from the regional branches, where denotes the standardized reference sequence from the headquarters side, and represents the live operational data sequence captured from the branch system. The standardized reference sequence is composed of specific data metrics that correspond to ideal system performance targets, encompassing target data transmission velocities, volumetric throughput capacity, and permissible node transmission failure rates.
Structural sequence characteristics are isolated utilizing an MGAN (Multi-Head Graph Attention Network) arranged in a Siamese configuration, which outputs two fixed-dimensional vectors ∈ and ∈ . Subsequently, these two distinct feature vectors are unified via concatenation to assemble a combined feature array L(, ), which is then processed through fully connected dense layers and a Softmax operator to yield the relative quality rating of the infrastructure. The underlying weight configurations of the MGAN sub-networks are held constant; during the active scoring phase, the system exclusively updates the weight matrices regulating the fully connected dense layers. Figure 6 provides a structural breakdown of the weight parameters governing these fully connected layers.
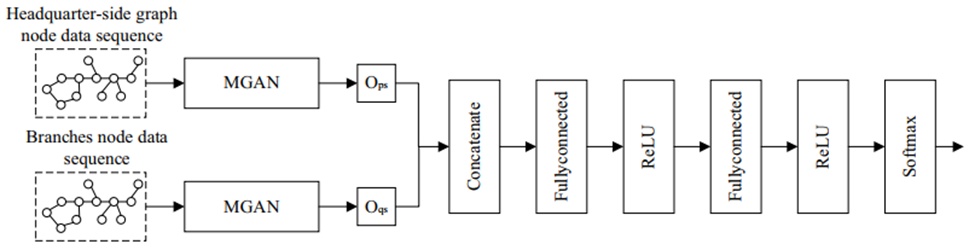
Figure 5. Structure of the comprehensive weighted quality assessment model for the new generation electric information collection system in the branches based on Siamese network
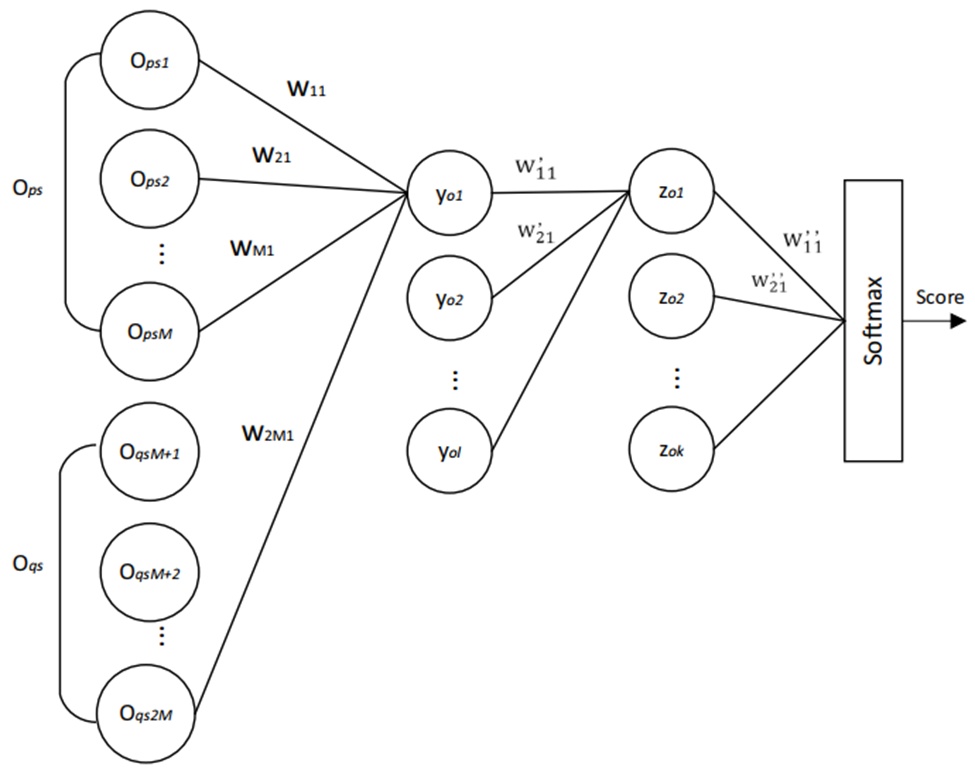
Figure 6. Fully connected layer weight parameter diagram for comprehensive weighted quality assessment
Algorithmic execution of the scoring estimation:
(1) The combined input data sequences mapping the diverse performance metrics of the system are determined as follows:
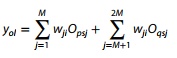 (12)
The leading term quantifies the performance impact of the standardized baseline data sequence processed through the headquarters-side model configuration, where structural bias parameters are omitted during calculation, and defines the weight parameter matrix mapping the output vector of the MGAN framework.
(2) The hidden layer structural output vector z is computed in accordance with the following formulation:
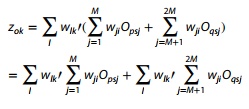 (13)
where symbolizes the distinct weight configurations assigned to each independent evaluation index. The initial term similarly signifies the performance impact of the standardized baseline data sequence injected from the headquarters-side model framework. The projected quality score of the evaluated infrastructure is defined as:
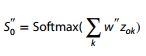 (14)
where denotes the weight parameter matrix utilized to resolve the construction quality evaluation rating of the system.
By adopting the derived similarity index as an accuracy compensation weight for calibrating the mirrored simulation modeling against the direct deployment architecture, the framework isolates and curtails operational variances that exist between the virtualized test environment and the actual production environment across the branch-level network nodes. The mathematical computation of these accuracy compensation weights is defined as follows in Eq. 15:
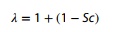 (15)
where Sc represents the vector similarity score determined via Eq. 11. Regulated by these calculated accuracy compensation weights, the actualized performance scores for each functional node are isolated through the following approach:
 (16)
The Softmax mathematical function maps the resulting values strictly within a 0 to 1 domain; within this context, metrics are evaluated to two decimal places. Assuming the authentic quality appraisal target score of a given system indicator is defined as d, the specialized training loss function utilized across the diverse metrics of the system is derived as follows:
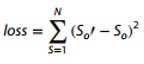 (17)
where N specifies the total volume of input data sequences processed by the network.
The individual actualized scores computed for each functional node are aggregated and averaged to present a unified metric:
 (18)
The variable n signifies the total number of operational functional nodes (corresponding to the vertex count within the graph neural network framework), and the resulting scalar value Score designates the final authenticated quality rating of the evaluated system.
To validate and train the proposed framework, empirical branch datasets were gathered from the operational monitoring and business collection logs of a next-generation provincial system. The target data window spans from November 2023 to June 2024. The business dataset encompasses three primary operational categories: task scheduling, load forecasting, and electricity data collection. Meanwhile, the operational telemetry tracks 22 distinct functional node types linked to these business activities, with data sampled at a uniform interval of 15 min. This monitoring framework captures comprehensive cluster service loads, overall cluster resource utilization, and the specific footprints of active jobs. More specifically, overall cluster resource tracking entails measuring CPU utilization, memory consumption, and active container counts. The service load reflects the hardware consumption profiles of individual servers within the cluster, whereas active job data isolates real-time resource demands. These continuous monitoring streams serve as the primary node input features for the graph convolutional neural network. Concurrently, the business collection logs provide the ground truth required to benchmark and assess the execution quality and processing timeliness across all functional nodes.
The experimental environment was developed in the Python programming language, with the graph attention neural network model—designated herein as MGAN—constructed and compiled within the PyCharm IDE. For baseline comparison, a standard graph convolutional neural network was implemented and denoted as GCN (Graph Convolution Network) [20]. The complete algorithmic architecture was developed using the PyTorch library. Hardware acceleration and computation were supported by an Intel i9-14900KF CPU alongside an NVIDIA RTX4080 GPU.
The prediction accuracy of the graph attention neural network was validated through two primary statistical metrics, namely Accuracy and F1 score, which are computed via Eqs. 19 to 22:
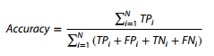 (19)
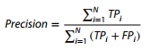 (20)
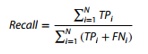 (21)
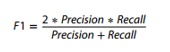 (22)
Selection of attention heads
To successfully synthesize neighborhood features from multiple structural perspectives, a series of sensitivity analyses were conducted regarding the total number of attention heads. As demonstrated in Figure 7, an increase in the head count parameter K initially yields a corresponding rise in both Accuracy and F1 score. This trend confirms that the hyperparameter positively guides the network's optimization process. The configuration reaches its peak efficiency at K = 3, where the Accuracy and F1 score stabilize at their maximum values of 89.16% and 89.21%, respectively. Beyond this threshold, further expansions in the number of heads cause a noticeable drop in both performance metrics relative to the K = 3 benchmark. This performance decay suggests that an overabundance of local neighborhood inputs introduces information redundancy, prompting the model to overfit. Consequently, the optimal value for hyperparameter K is set to 3.
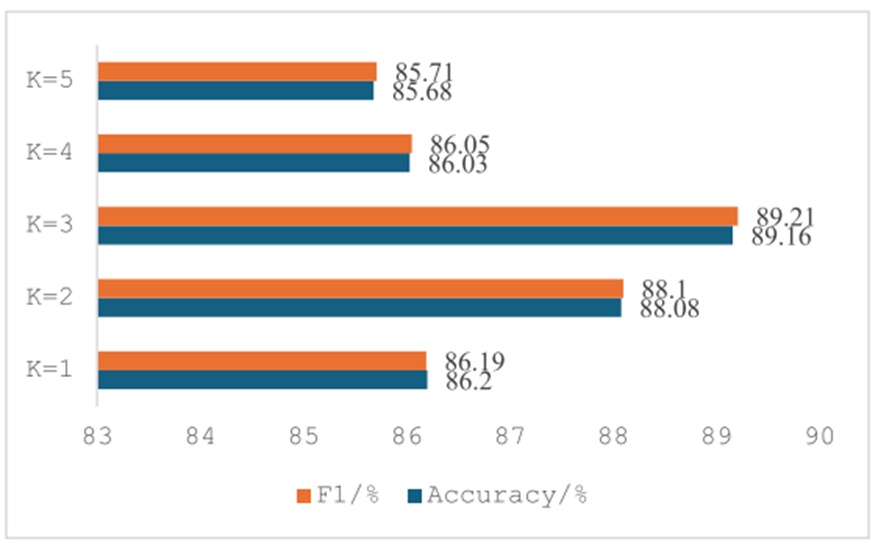
Figure 7. Experimental results of attention head count parameter
Nodes featuring a direct edge connection to the target element constitute the primary tier of graph attention. Conversely, adjacent nodes separated from the target by a single intermediary reside in the secondary tier, with this spatial progression extending outward for subsequent degrees of separation. The depth of these attention layers substantially influences the resulting predictive Accuracy and F1 score. The present study evaluated the model's sensitivity across a range of 1–5 layers, with the empirical trends plotted in Figure 8.
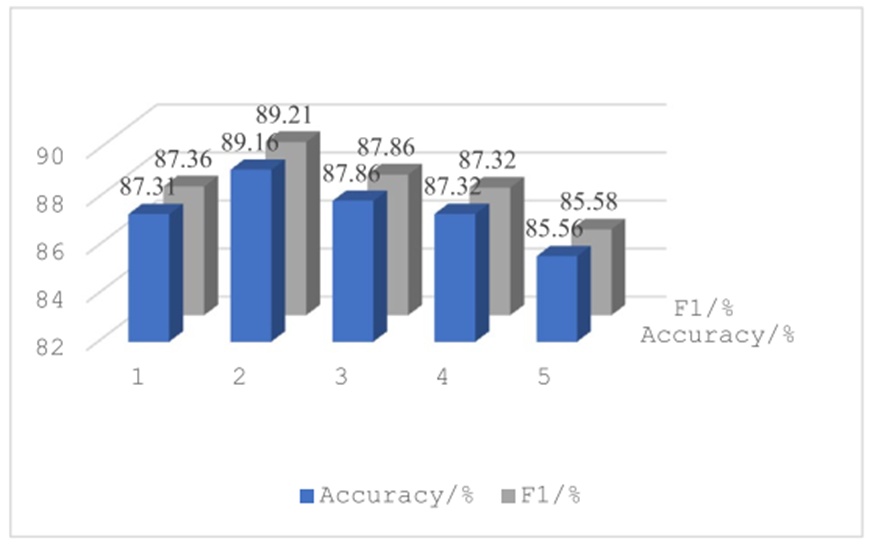
Figure 8. Experimental results of graph attention layer
An examination of the empirical results reveals that selecting a depth of 2 graph attention layers optimizes model output, producing the highest recorded Accuracy and F1 scores. This indicates that aggregating either an excessive or insufficient volume of neighboring node features at the target site undermines the final prediction accuracy. For this reason, a structural depth of 2 layers was chosen as the standard design parameter.
To benchmark the effectiveness of the proposed architecture, a conventional graph convolutional neural network served as the comparative baseline. The resulting performance metrics are organized in Table 1.
Table 1. Comparative experiment results
Model | Accuracy/% | F1/% |
|---|---|---|
MGAN | 89.16 | 89.21 |
GCN | 87.15 | 87.15 |
Based on the comparative findings, the proposed MGAN model consistently outperforms the GCN framework across both metrics, securing an accuracy advantage of 2.01% and an F1 score improvement of 2.06%. This performance edge stems directly from MGAN’s capacity to fuse multi-perspective data from adjacent nodes, which yields a much richer feature space. Consequently, this enhances the system's ability to precisely categorize the deployment quality of functional nodes, thereby elevating overall network performance.
An ablation study was executed to verify the practical contribution of the accuracy compensation weights, with the results detailed in Table 2. Focusing on the system's power consumption data collection, load forecasting, and task scheduling modules as representative case studies [21], the incorporation of these compensation weights into the unified quality assessment framework brought the calculated construction quality scores into close alignment with, or exact equivalence to, the scores derived from manual expert reviews. This alignment confirms the validity and utility of the proposed accuracy compensation weighting mechanism.
Table 2. Results of Accuracy Compensation Weight Ablation Experiment
Business Scenario | λ+/% | λ-/% | business Indicator Completion Rate% |
Power consumption data collection | 97.92 | 96 | 97.9 |
Load forecasting | 95.95 | 94 | 95.89 |
Task scheduling | 99.96 | 98 | 99.96 |
In Table 2, represents the evaluation model with accuracy compensation weights incorporated, while represents the evaluation model without accuracy compensation weights. The business indicator completion rate denotes the comprehensive evaluation score of the system directly calculated by the staff.
The evaluation pipeline began with an initial construction quality audit of the graph nodes mapped to the various functional blocks of the power consumption information collection system. This phase evaluated standalone performance dimensions—specifically data transmission speed, volumetric capacity, transmission reliability, code coverage, and anomaly detection rates—to independently gauge different operational facets of each node. Once these individual dimensions were quantified, the comprehensive weighted quality assessment score integrated all five metrics into a unified value. By factoring in the performance variables across all operational domains, the resulting synthesis delivers a more resilient and authoritative appraisal. The experiment examined three business processes within the infrastructure: power consumption data collection, load forecasting, and task scheduling, labeled as T1, T2, and T3, respectively.
In scenarios where individual performance dimensions present conflicting trends, a multidimensional appraisal is necessary to secure stable and authoritative insights. Figure 9 and Table 3 detail the evaluation data derived from testing the three distinct nodes. The empirical results reveal distinct instances of divergence among standalone indicators, demonstrating that it is difficult to determine the superior module using isolated criteria. For example, under the code coverage metric, the performance is uniform (T1 = T2 = T3). However, the anomaly detection metric yields a hierarchy of T2 > T3 > T1, whereas the data throughput metric reverses this order to T1 > T2 > T3. This variation proves that separate functional nodes maintain distinct architectural priorities. For the T1 module, the descending order of performance efficiency is code coverage > data processing rate > anomaly detection rate > data transmission success rate = data throughput. Conversely, the hierarchy for T3 shifts to code coverage > data transmission success rate > data processing rate > anomaly detection rate > data throughput. By consolidating these five distinct vectors into a single metric, the comprehensive weighted quality assessment score enables a multidimensional trade-off, widens the evaluation scope, and yields dependable aggregate findings. Ultimately, the system yielded holistic quality scores of 96% for power consumption data collection, 94% for load forecasting, and 98% for task scheduling.
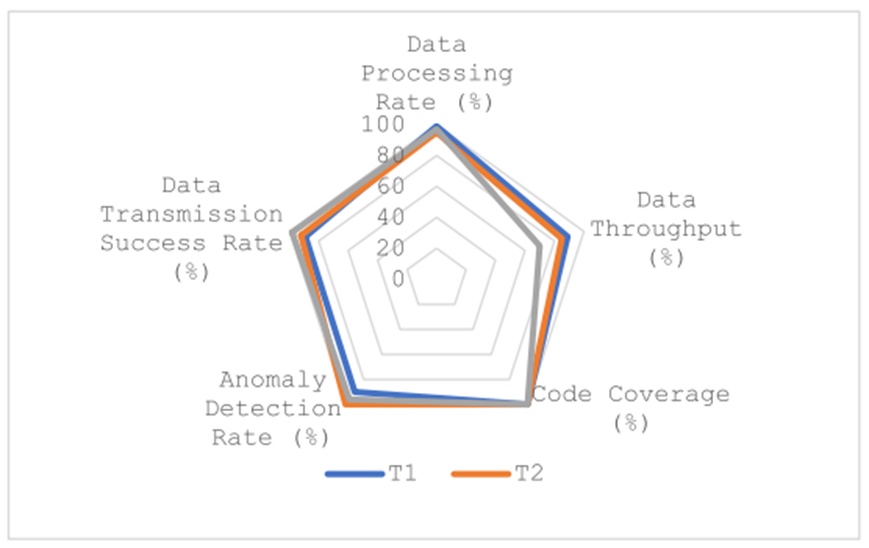
Figure 9. Diagram of evaluation indicators for system internal functional modules
Table 3. Evaluation results
label | Data processing rate(%) | Data throughput(%) | Code Coverage(%) | Anomaly detection rate (%) | Data transmission Success rate (%) | Comprehensive Weighted Score |
T1 | 99 | 89 | 100 | 90 | 89 | 96 |
T2 | 95 | 85 | 100 | 100 | 92 | 94 |
T3 | 97 | 70 | 100 | 96 | 98 | 98 |
The regional operational telemetry from the next-generation power information collection branches, along with simulated terminal metrics from the central headquarters, are routed into a headquarters-hosted Siamese neural network. The final accuracy compensation values for the three target nodes are subsequently derived based on their operational similarity profiles, as recorded in Table 4.
Table 4. Similarity scores for each quarter
Node | similarity | Compensation Accuracy |
T1 | 98 | 1.02 |
T2 | 99 | 1.01 |
T3 | 98 | 1.02 |
By integrating the calculation of accuracy compensation across the three distinct nodes, the refined indicators for evaluating construction quality within each operational scenario are established as follows: power consumption data collection achieves 97.92% (derived from 96\% \times 1.02), load forecasting reaches 95.95% (derived from 95\% \times 1.01), and task scheduling secures 99.96% (derived from 98\% \times 1.05). The total engineering quality rating of the branch infrastructure is extrapolated from these unified individual node scores, thereby defining the overall construction quality standard of the system. Furthermore, temporally localized construction quality metrics for the branch system are calculated on a quarterly basis using these operational similarity profiles, providing an empirical means to validate the system's ongoing construction quality tier.
On the basis of these aggregated scoring benchmarks, the evaluation framework is stratified into four distinct performance tiers: Level I, Level II, Level III, and Level IV. Specifically, an evaluation interval of 90–100 signifies Level I, 80–90 denotes Level II, 70–80 represents Level III, and any score falling under 70 is classified as Level IV. The exact breakdown of this grading matrix is organized in Table 5.
Table 5. Score grading
score | level |
90–100 | I |
80–90 | II |
70–80 | III |
70 and below | IV |
In addition, the longitudinal analysis tracking the quarterly validation of the branch system's construction quality baseline over time is documented in Table 6.
Table 6. Quality verification statistics for the branches system
Quarter | Construction Quality Level | Verification Level |
1 | I | I |
2 | I | I |
3 | II | I |
4 | II | II |
As indicated by the compiled data, the proposed comprehensive weighted quality assessment methodology initially categorized the branch system's third-quarter construction quality as Level II. Nonetheless, following the verification process powered by the Siamese twin network similarity analysis, the definitive performance rating was adjusted upward to Level I. This capacity for real-time, dynamic validation provides an active mechanism for oversight regarding the installation and construction quality of regional branch systems.
This research introduces a two-level unified construction quality evaluation methodology that combines graph neural networks with Siamese twin architectures to execute a comprehensive weighted quality assessment. Given that next-generation electrical information collection systems rely on a highly distributed layout, their structural design exhibits significant complexity and heterogeneity. This differentiation among operational components makes objective and equitable verification difficult to achieve. To overcome this, historical data streams from regional branch power grid networks are compiled and structured into a graph repository. This repository feeds a graph multi-head attention neural network that undergoes optimization to classify the structural quality tiers of the system. Once trained, this network is implemented directly at the headquarters as an operational deployment model, taking in localized terminal data and time-series operational telemetry from various nodes. Concurrently, an identical copy of this network is integrated within the headquarters' simulated evaluation environment, which processes synthetic terminal inputs scaled to mirror the data volume of the actual branch infrastructure. Ultimately, a Siamese network architecture compares the telemetry from headquarters and the regional branches to establish accurate compensation weights. These weights serve to validate and adjust the various operational indices, yielding a finalized, comprehensively weighted quality evaluation matrix for the next-generation electrical information collection branch systems. By assessing construction quality through a multi-perspective lenses, the proposed weighting method broadens the analytical scope and reinforces the validity of the findings, establishing a sustainable framework for the objective, holistic auditing of next-generation infrastructure deployments. At present, these advanced power information collection systems are in their nascent deployment phases. As central headquarters accommodate larger volumes of data and face stricter operational requirements regarding business throughput and service fidelity, subsequent research must focus on feedback-driven optimization techniques to accelerate the deployment and maturity of these next-generation systems.
None
None
This research is supported by National Grid Corporation Headquarters Technology Project - Key Technology Research on Integrated Operation of Electricity Information Collection and Collaborative Analysis Application across the Entire Network (5108-202218280A-2-255-XG).
None
Open Access The author(s) retain copyright. This article is licensed under the Creative Commons Attribution-NonCommercial-ShareAlike 4.0 International License. It may be shared and adapted for non-commercial purposes with appropriate attribution, an indication of changes, and distribution of adaptations under the same license. Third-party material may be subject to separate terms identified in its credit line. View the license at https://creativecommons.org/licenses/by-nc-sa/4.0/.
 Transparent Intelligence Publishing