Among the most critical and fatal medical conditions are brain malignancies, making early identification vital for enhancing survival rates. Currently, magnetic resonance imaging (MRI) stands as the premier diagnostic tool for early detection because of its exceptional capability to capture soft tissue details. Nevertheless, relying solely on human interpretation of brain MRI scans introduces risks of oversight, which are frequently exacerbated by the fatigue and varying expertise of radiologists. To mitigate these limitations, computer-aided diagnosis (CAD) systems have taken on an increasingly vital role. Leveraging state-of-the-art computer vision methodologies like deep learning, these systems generate highly precise diagnoses from clinical imagery, thereby boosting both precision and consistency in clinical settings. This study introduces an innovative CAD architecture designed for multi-class classification of brain malignancies. The system evaluates six pre-trained deep learning networks as its foundational architecture, integrating robust data preprocessing and augmentation protocols to optimize computational throughput. To counter the opaque "black box" nature of deep learning architectures and improve interpretability, Gradient-weighted Class Activation Mapping (Grad-CAM) is integrated to illuminate the network's deductive steps when identifying anomalies in MRI data. Furthermore, an accessible, web-based Brain Tumor Detection System was constructed using the Streamlit framework, highlighting its utility for clinical environments and offering meaningful support to medical professionals. All experimental simulations were carried out using an open benchmark repository, proving that the introduced system delivers state-of-the-art diagnostic capabilities, achieving accuracy levels near 99% with the ResNet-50, Xception, and InceptionV3 architectures.
A brain tumor is characterized by the uncontrolled division of atypical cells within the cranium, a process that can harm vital cerebral architecture and eventually develop into malignancies [1]. Statistical projections from the American Cancer Society indicate that approximately 24,810 individuals will face diagnoses of malignant intracranial tumors in 2024, alongside an estimated 18,990 fatalities attributed to these conditions [2]. Human oncology identifies roughly 150 unique varieties of intracranial tumors, which are generally segregated into benign and malignant categories [3]. Benign growths exhibit slow development and do not invade adjacent anatomical sites, making them inherently less life-threatening than malignant variants, which display aggressive behavior and swift metastasis [4]. Within the malignant category, the most frequently diagnosed variants include Gliomas, Meningiomas, and Pituitary tumors [5]. Gliomas arise directly from cerebral glial cells and prove highly destructive because of their rapid expansion. Meningiomas form on the protective dural layers encapsulating the brain and spinal cord, frequently triggering pronounced neurological deficits as their volume increases [6]. Pituitary tumors, though predominantly benign in nature, develop within the pituitary gland and can still compromise systemic health via critical hormonal disruptions and compressive effects on neighboring intracranial elements.
In clinical practice, magnetic resonance imaging (MRI) remains the premier diagnostic modality for localized brain tumor identification, favored for its capacity to generate high-contrast representations of soft tissue matrices [7]. Even so, the manual evaluation of these neuroimages demands substantial specialization and clinical tenure, creating persistent risks for diagnostic errors [8]. Lately, the paradigm of intelligent healthcare has gained major traction, propelled by breakthroughs in the domains of computer vision and natural language processing [9]. CAD systems perfectly embody this technological shift by delivering rapid, precise evaluations of medical imagery, ensuring uniform and reproducible diagnostic outputs. Such systems offer immense utility for the timely and precise identification of intracranial lesions, which is indispensable for formulating successful treatment pathways [10].
Merging deep learning algorithms with clinical expertise allows modern radiology to augment the diagnostic proficiency of human practitioners [11]. Because prompt identification is essential for designing successful intervention strategies, deep learning frameworks provide a distinct edge by accelerating this diagnostic timeline [12]. Although tissue biopsy continues to be the most definitive approach for establishing exact tumor pathology, its invasive nature and inherent clinical risks have spurred the development of dependable, non-invasive alternatives based on MRI data. Machine learning models utilize these neuroimaging datasets to successfully distinguish between diverse tumor pathologies. Specifically, Convolutional Neural Networks (CNNs) and their advanced derivations—including Inception, Xception, MobileNet, and EfficientNet—have demonstrated great efficacy in classifying intracranial anomalies via MRI inputs [13].
However, utilizing deep learning methodologies for categorizing brain tumors involves overcoming several distinct obstacles. First, the computational overhead of deep CNN frameworks is massive due to their dense parameter spaces, which demands prolonged training durations even when utilizing high-performance hardware configurations [14]. A second major hurdle involves data availability [15]. Deep CNN paradigms depend heavily on massive, annotated training repositories [16, 17], but annotating medical imagery demands rare clinical expertise, resulting in dataset volumes that are significantly smaller than those available for mainstream computer vision tasks. This data scarcity often triggers overfitting when deep architectures undergo training on restricted data samples. Finally, marked structural differences, highly intricate tumor presentations across images, and inconsistent lighting distributions introduce further analytical difficulties. Overcoming these nuances requires the implementation of highly effective classification methodologies to provide reliable decision support for clinical radiologists [18].
To circumvent these issues, this study establishes a dependable architectural framework for the multi-class categorization of brain lesions using MRI scans, utilizing deep learning and transfer learning paradigms. The core innovations introduced in this research are structured as follows:
Established an efficient framework for multi-class brain tumor classification. This diagnostic pipeline uses MRI data as an input and is engineered to refine both the precision and processing speed when identifying distinct types of intracranial tumors.
Developed and optimized multiple deep learning models. These computational architectures leverage transfer learning concepts and are meticulously calibrated for the Brain Tumor MRI Dataset, repurposing pre-trained models to secure superior classification results.
Designed a Grad-CAM-based interpretability method. This analytical approach serves to visually map the internal decision-making trajectories within the deep learning architectures during tumor classification, thereby bolstering transparency and clinical trust in the network's deductions.
Engineered a practical Brain Tumor Detection System with Streamlit, focusing heavily on elevating user interaction dynamics and diagnostic availability in medical environments.
Intracranial lesions display pronounced heterogeneity in clinical presentation and severity, which are primarily governed by variables such as anatomical location, volumetric dimensions, and histological grade [19]. Achieving a deep comprehension of these distinct classifications is paramount for designing tailored therapeutic regimens and driving forward oncological research. This section delivers a brief synthesis of contemporary breakthroughs in classifying brain pathologies via neuroimaging. Table 1 provides a comparative analysis of these diagnostic methodologies, spotlighting a selection of recently published studies. This synthesis details the specific computational architectures deployed, the underlying datasets (specifying sample size and imaging modalities), the scope of the classification tasks, and the unique hurdles encountered by each research group. This structured comparison is intended to illuminate prevailing technical trends and their potential to elevate diagnostic precision and patient care.
Rajput et al. [13] (2024) introduced a diagnostic methodology leveraging pre-trained CNN topologies including VGG19, InceptionV3, and ResNet-50 via a transfer learning paradigm. These deep networks were used to isolate features from MRI volumes, followed by fine-tuning via fully connected layers for multi-class pathology classification, yielding a mean accuracy of 90%. However, a notable constraint of their work lies in reserving a mere 10% of the available data for validation, which can markedly degrade the reliability of the assessment by failing to provide an adequate representation of the broader patient population. Furthermore, any prior leakage of test distribution characteristics introduces potential bias, compromising the validity of the evaluation and restricting the generalizability of the model.
Wang et al. [20] (2024) developed RanMerFormer, an innovative architecture for the categorization of brain tumors. This system centers on a pre-trained vision transformer model and integrates a token-merging protocol to lower computational overhead by filtering out redundant tokens. Furthermore, a randomized vector functional link network is incorporated to accelerate the model training phase. Validation across two public benchmarks demonstrated that RanMerFormer achieves state-of-the-art results, indicating strong viability for clinical deployment. Nevertheless, the system faces criticism regarding its significant computational footprint and overall architectural complexity.
Mehnatkesh et al. [21] (2023) proposed an advanced methodology that fuses deep learning with evolutionary computation for neuroimage classification. Their research focuses on automated engineering of optimized ResNet topologies utilizing a metaheuristic strategy designated as IACO-ResNet. This optimization routine fine-tunes both the network topology and hyperparameters using differential evolution coupled with multi-population operators, designed to balance solution diversity against convergence velocity. The primary drawback identified in this approach is the computationally intensive and protracted nature of the optimization cycle.
Zhu et al. [22] (2023) introduced RBEBT, an innovative model employing a fine-tuned ResNet-18 architecture as a feature extractor for brain tumor scans. Departing from conventional CNN designs, RBEBT routes these features into a randomized neural network for final classification, with the network being optimized via the bat algorithm (BA). Critiques of this work point out a lack of extensive comparative evaluation and the limitation of the framework to strictly binary classification tasks.
Asif et al. [23] (2023) presented a transfer learning paradigm for the multi-class classification of brain lesions from MRIs. Their work utilized prominent networks including Xception, DenseNet201, DenseNet121, ResNet152V2, and InceptionResNetV2, augmented by a dense block and a softmax layer to maximize classification performance. The authors validated their framework through experimental runs on three-class and four-class diagnostic problems, confirming its capabilities. However, relying exclusively on single-protocol T1-weighted (T1W) MRI scans serves to restrict the model's broader clinical generalizability.
Sharma et al. [24] (2023) proposed a brain lesion identification method rooted in a transfer-learned ResNet-50 architecture. Their strategy involved modifying the baseline ResNet-50 framework by stripping its terminal layer and introducing custom layers configured to match the precise demands of the classification task. Empirical testing demonstrated elevated accuracy in categorizing cerebral malignancies. Nevertheless, the study faced challenges regarding limited dataset availability and a narrow focus on binary diagnostic problems.
Kumar et al. [25] (2023) introduced a novel Convolutional Neural Network designed to classify brain MRI scans into either benign or malignant classes through a transfer learning approach. The authors compared their custom network against several established pre-trained models, demonstrating its clinical potential. A primary limitation highlighted in their study, however, was the constrained scale of the dataset utilized for training and performance assessment.
Table 1. A comparative study of brain tumor classification methods.
Study (Author, Year) | Applied Models | Data Source(s) | Tumor Categories | Image Count | Classification Scheme | Reported Limitation |
Rajput et al., 2024 [13] | VGG19, InceptionV3, ResNet-50 | Brain tumor MRI dataset | Glioma, Meningioma, Pituitary, No-tumor | 7023 | Multi-class | Limited testing subset and possible bias arising from prior knowledge of test samples |
Wang et al., 2024 [20] | RanMerFormer | Brain tumor MRI dataset, Figshare dataset | DS1: Glioma, Meningioma, Pituitary, No-tumor; DS2: Glioma, Meningioma, Pituitary | DS1: 7023; DS2: 3064 | Multi-class | Computationally intensive with increased system complexity |
Mehnatkesh et al., 2023 [21] | IACO-ResNet | Figshare dataset | Glioma, Meningioma, Pituitary | 3064 | Multi-class | Requires substantial processing time |
Zhu et al., 2023 [22] | RBEBT | Harvard Medical School website | Normal brain, Cerebrovascular disease, Neoplastic disease, Degenerative disease, Infectious disease | Not reported | Binary | No comparative evaluation against alternative methods |
Asif et al., 2023 [23] | Xception | Brain Tumor Classification (MRI), Figshare dataset | DS1: Glioma, Meningioma, Pituitary, No-tumor; DS2: Glioma, Meningioma, Pituitary | DS1: 3264; DS2: 3064 | Multi-class | Relied exclusively on T1W MRI acquisition protocol |
Sharma et al., 2023 [24] | ResNet-50 | Kaggle dataset | Benign, Malignant | Not reported | Binary | Dataset not publicly accessible |
Kumar et al., 2023 [25] | ResNet-50 | BMIBT dataset | Benign, Malignant | 159 | Binary | Very small dataset size |
The present study introduces a robust computer-aided diagnosis (CAD) architecture designed for comprehensive Brain Tumor Classification. Depending on anatomical presentation, the model differentiates between benign and malignant manifestations and categorizes them into specific pathological families, namely Glioma, Meningioma, and Pituitary tumors. To mitigate the persistent challenge of data scarcity during deep learning training, the expansive Brain Tumor MRI Dataset [26] was adopted. This composite repository compiles data from Figshare, the SARTAJ collection, and the Br35H database, yielding an aggregate of 7023 images—representing the largest public data collection currently accessible for this domain of medical research.
Furthermore, Gradient-weighted Class Activation Mapping (Grad-CAM) was integrated in an innovative fashion to visually chart the underlying feature dependencies within the deep learning models. This step injects interpretability and transparency into the network's predictive rationale, which are dimensions frequently neglected in earlier implementations. In tandem with the core models, a functional brain lesion diagnostic application was constructed utilizing the Streamlit framework to showcase its utility in real-world environments. This interface is built to support smooth engagement with clinical practitioners and accelerate the adoption of deep learning tools within hospital environments. Finally, rigorous benchmarking against alternative models was carried out on identical data resources, successfully addressing a prominent gap in current academic literature where direct comparative validations are often missing.
The architecture of the introduced system is illustrated in Figure 1, providing a conceptual overview of the sequential phases involved in categorizing brain tumors from MRI inputs. The pipeline progresses through several critical stages: Initially, the Brain Tumor MRI Dataset, which comprises Meningioma, Glioma, and Pituitary neuroimages, was compiled from open-access web repositories. Following acquisition, detailed image preprocessing routines were executed to elevate baseline data quality. Next, the curated images were randomly partitioned into separate training, testing, and validation sub-distributions, with data augmentation operations restricted exclusively to the training subset to expand its variance.
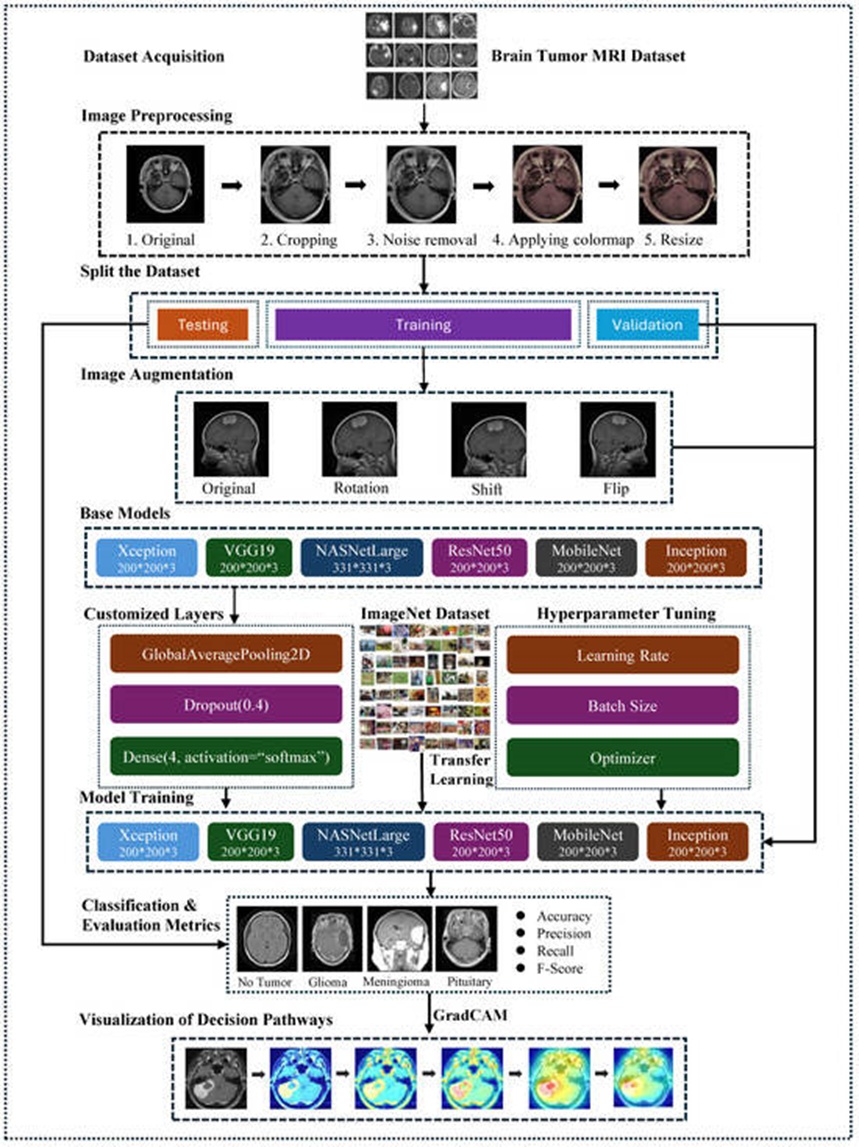
Figure 1. The structure of the proposed framework for brain tumor classification.
Moving forward, this research evaluated six distinct fine-tuned, pre-trained neural network architectures: VGG19, ResNet-50, Xception, MobileNetV2, InceptionV3, and NASNetLarge. These deep topologies were selected to benchmark their relative capabilities in identifying separate classes of intracranial malignancies. The CNN frameworks were initialized using pre-trained weight distributions, with their terminal classification layers modified to match the target pathological classes (Meningioma, Pituitary, and Glioma). The performance profile of the proposed architecture was rigorously analyzed via conventional evaluation metrics, including overall accuracy, specificity, sensitivity, F1-score, and confusion matrix analysis.
To maximize clinical transparency and understand the diagnostic mechanics, Grad-CAM was deployed to map the spatial focus of the models. This visualization technique provides an explicit view of how the deep networks derive their diagnoses based on the structural features present in the brain MRIs.
The Kaggle-sourced neuroimaging repository used in this study represents an expansive diagnostic resource, containing a total of 7023 MRI volumes. These scans are categorized into one of four distinct target classes: Glioma tumors, Meningioma tumors, Pituitary tumors, and a control class representing the absence of tumors [26]. This diagnostic taxonomy is mapped out in Figure 2, providing a clear breakdown of the dataset's internal breakdown. The repository achieves structural diversity by blending scans from Figshare, the SARTAJ dataset, and the Br35H collection. For experimental execution, the data is split into training and testing cohorts. The training cohort consists of 1457 Pituitary, 1339 Meningioma, 1321 Glioma, and 1595 tumor-free scans. Concurrently, the independent testing cohort contains 300 Pituitary, 306 Meningioma, 300 Glioma, and 405 tumor-free scans.
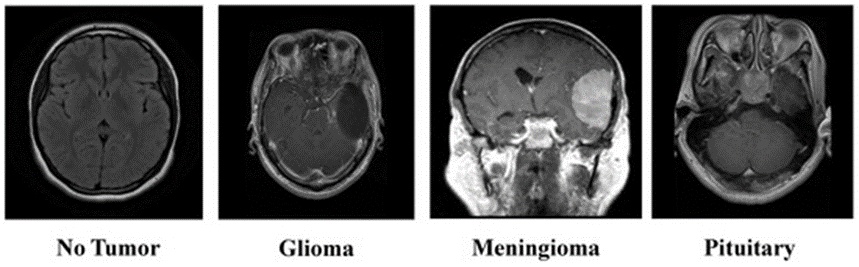
Figure 2. Overview of the brain tumor MRI dataset.
Refining imagery through systematic preprocessing is essential for boosting the diagnostic capabilities of deep learning models, particularly within the domain of clinical neuroimaging. This research implemented a structured sequence of preprocessing operations on the Brain Tumor MRI Dataset to condition the inputs for neural training and maximize classification accuracy. The pipeline incorporates anatomical cropping, noise mitigation, colormap mapping, and spatial resizing. Each operation plays a distinct role in cleaning the raw scans, ensuring that the feature-extraction layers prioritize clinically relevant biomarkers while establishing a standardized input format across the entire data repository.
The primary phase of the preprocessing pipeline centers on image cropping, which is critical for stripping away extraneous background artifacts present in raw MRI records. This background noise often includes non-cerebral anatomy or scanning artifacts that provide no diagnostic value for lesion identification. Implementing a localized crop allows the network to isolate the primary cerebral structures where anomalies develop, thereby increasing the fidelity of downstream feature extraction. By bounding the region of interest (ROI), the computational architecture avoids learning irrelevant background patterns, which systematically upgrades the quality of the dataset before model ingestion.
Figure 3 maps out the four technical phases involved in isolating the cerebral region from a raw brain tumor MRI scan:
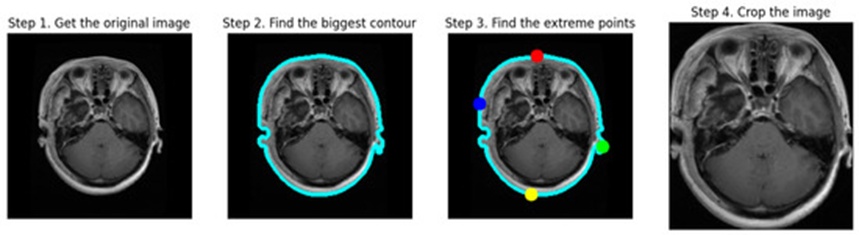
Figure 3. The cropping process of MRI scans.
Step 1: Obtain the Original Image. The initial frame captures the unaltered neuroimage, showing the full cranial structure alongside peripheral tissues and background space.
Step 2: Find the Biggest Contour. In the second frame, a contour detection algorithm outlines the largest continuous boundary (marked by a blue outline) around the brain, localizing the target tissue.
Step 3: Find the Extreme Points. The third frame highlights the outer spatial boundaries (indicated by red, blue, green, and yellow coordinate markers) along the cerebral edge, which serve as the references for the bounding box.
Step 4: Crop the Image. The terminal frame displays the resulting cropped MRI, which strictly retains the brain matter while discarding non-relevant components like epithelial tissue and background pixels. This produces a tightly focused representation of the brain, optimizing subsequent processing and classification tasks.
Following the cropping routine, noise mitigation is achieved by applying a bilateral filtering technique. The bilateral filter is highly effective for processing MRI records because it dampens background variations while strictly maintaining structural boundaries and delicate tissue details [27]. Unlike standard spatial filters that can inadvertently blur critical anatomical interfaces alongside noise, the bilateral approach evaluates both spatial proximity and radiometric intensity variations among neighboring pixels. This dual evaluation enables the filter to suppress high-frequency noise while preserving sharp edge gradients, which is essential for delineating precise tumor borders. Given that the underlying MRI data may originate from diverse scanner protocols and configuration settings, baseline noise levels vary across samples; the bilateral filter enforces a uniform standard of clarity without compromising valuable structural information.
The next phase involves mapping a localized colormap over the cropped and filtered images. Introducing a colormap boosts the interpretability of the MRI scans by amplifying the visual contrast between heterogeneous tissue types and distinct cerebral structures. In standard grayscale MRIs, minute variations in tissue density or pathological margins can be difficult to distinguish. Applying a colormap accentuates these subtle gradients, assisting both computational networks and clinical observers in isolating anomalies. By translating scalar pixel intensities into specific color spaces, this step adds visual depth that highlights vital diagnostic features, notably the boundaries separating healthy tissue from tumor masses. This transformation is highly valuable in medical imaging, where explicit visualization of structural abnormalities dictates diagnostic precision.
The final preprocessing phase involves spatial resizing, which standardizes the input dimensions of the images before they are fed into the network. Deep learning networks, particularly deep CNNs, require uniform tensor dimensions for all incoming data arrays [28]. Resizing guarantees that every image in the dataset matches these strict spatial constraints, ensuring uniform matrix operations during the forward pass. Standardizing the tensor dimensions also controls computational overhead and memory allocation, leading to faster training cycles. Throughout the resizing process, the original aspect ratio is maintained to prevent geometric distortion, which could otherwise corrupt crucial diagnostic shapes. In these experiments, images were scaled to an array size of $200 \times 200$ pixels, with the sole exception of the NASNetLarge network, which necessitated an input matrix of $331 \times 331$ pixels.
Completing this sequence of operations yields the refined brain tumor MRI scans illustrated in Figure 4. This preprocessing pipeline systematically cleans the imagery, allowing the deep learning frameworks to efficiently target pertinent anatomical features. Unwanted outer regions are discarded via cropping, image clarity is maximized through noise filtering, visual presentations are standardized using colormaps, and consistent tensor shapes are established via resizing. The complete workflow is designed to optimize the training data for superior diagnostic accuracy.
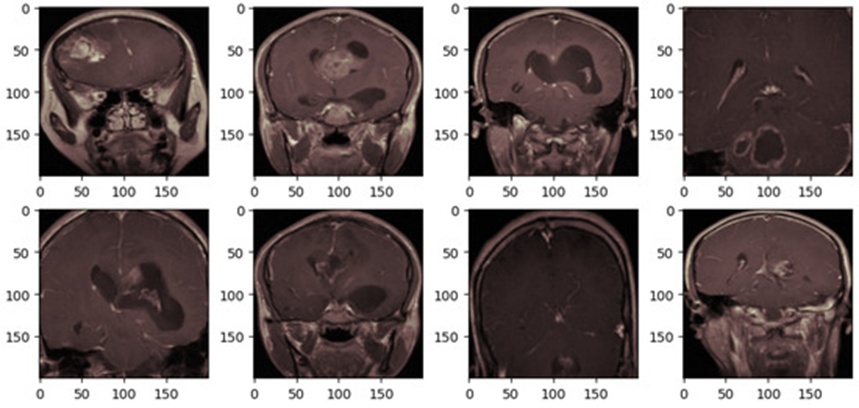
Figure 4. The brain tumor MRI after preprocessing.
Dividing the primary data repository into isolated subsets for training, validation, and testing purposes is crucial for verifying model stability and assessing its generalization capacity on unseen data [29]. For this study, the global dataset was structured into three distinct subsets—training, validation, and testing—as detailed in Table 2.
Table 2. The details and distribution of datasets.
Category | Test Samples | Validation Samples | Training Samples |
Glioma Tumor | 300 | 261 | 1060 |
Meningioma Tumor | 306 | 267 | 1072 |
Pituitary Tumor | 300 | 299 | 1158 |
No Tumor | 405 | 316 | 1279 |
Overall Total | 1311 | 1143 | 4569 |
The training partition, containing a substantial baseline of 5712 images, is vital for allowing the network to internalize a wide spectrum of brain tumor features. To improve the model's adaptability and guard against overfitting, a 20% slice (comprising 1143 images) of this initial training collection was set aside as a validation set. This subset acts as an independent checkpoint for adjusting hyperparameters, ensuring the network learns robust, transferable feature representations rather than merely memorizing the training samples. While this validation loop runs periodically on its designated subset, the remaining 4569 images in the training cohort continue to drive the core optimization process, reinforcing the model's ability to generalize to new clinical cases.
Concurrently, a separate testing set consisting of 1311 images was kept entirely isolated during the model development and training cycles. Serving as the definitive evaluation tool for the system's clinical readiness, this completely unseen dataset provides an unbiased benchmark for measuring the framework's ability to categorize brain pathologies. Consequently, the model's accuracy on this test partition serves as a key indicator of its real-world utility, where the capability to correctly interpret novel patient scans is mandatory.
Clinical image repositories are incredibly valuable but present substantial administrative and technical challenges due to several compounding variables. Generating accurate annotations requires specialized medical expertise, as human errors during the labeling phase can degrade network optimization and skew predictive performance. Furthermore, strict data privacy protocols are necessary due to the highly sensitive nature of patient health records, which restricts open data sharing and complicates the assembly of large training cohorts. Ethical boundaries and legal mandates, such as the Health Insurance Portability and Accountability Act of 1996 (HIPAA), further restrict data management and access procedures, highlighting the complexities of medical data stewardship.
To counter the constraints imposed by limited medical dataset scales, the strategic deployment of image augmentation techniques becomes crucial [30]. The ImageDataGenerator class within the Keras library offers an efficient mechanism for executing real-time data augmentation during training [31]. By applying a variety of stochastic geometric adjustments—such as spatial rotations, pixel shifts, and coordinate flips—to each image during the mini-batch feed, this technique artificially expands the functional size of the training pool. This synthetic variance not only improves the network's generalizability but also prevents overfitting when working with small data distributions, playing an essential role in bolstering the overall stability of machine learning models targeting medical data.
Figure 5 presents a visual comparison of four sample brain tumor MRI scans before and after the introduction of these data augmentation transformations. The top row illustrates a randomized selection of four images taken from the preprocessed training set, corresponding to the style shown in Figure 4. The bottom row displays those identical samples after being processed through the real-time augmentation pipeline.
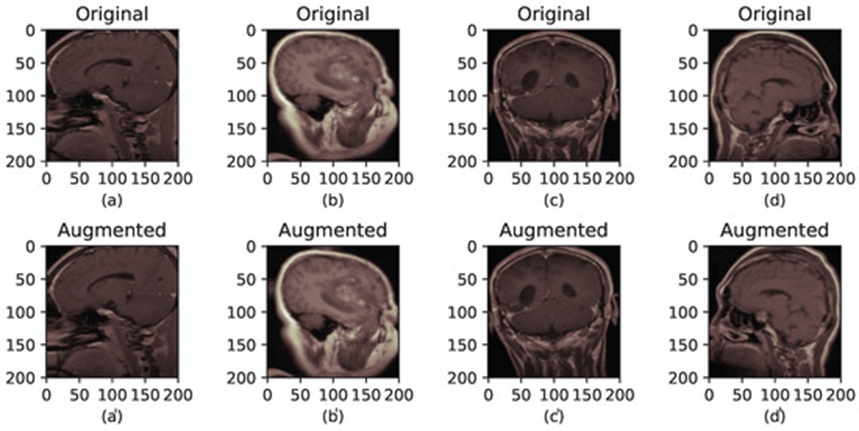
Figure 5. The brain tumor MRI before and after augmentation. (a–d) correspond to the original images, while (a′–d′) correspond to their augmented versions.
The specific configuration parameters deployed during the experimental phase were defined as follows: rotation_range = 10, width_shift_range = 0.05, height_shift_range = 0.05, and horizontal_flip = True. The rotation_range defines the maximum angular variation applied to each image array. Meanwhile, width_shift_range and height_shift_range establish the maximum limits for random horizontal and vertical pixel translations, respectively. Finally, the horizontal_flip logic dictates whether a sample matrix undergoes a horizontal reflection, governed by a uniform 50% probability distribution.
It is important to note that the geometric modifications managed by the ImageDataGenerator (including rotations, translations, and reflections) are assigned stochastically to each image array during execution. As a result, every generated mini-batch presents unique feature configurations. This stochastic behavior continuously injects structural diversity into the active training data, strengthening the model's capability to generalize across varying scan orientations.
Within the domain of deep learning, CNNs have established themselves as a foundational paradigm for image recognition objectives, owing to their capacity for autonomous feature extraction from raw visual inputs without demanding extensive initial data curation. The structural maturity of CNNs has progressed markedly through the integration of sophisticated methodologies—notably transfer learning via selective layer immobilization and fine-tuning—which has propelled their diagnostic precision far beyond the constraints of conventional machine learning algorithms [32].
At their core, these networks rely on an architectural arrangement comprising three distinct operational layers, each executed to fulfill a specific computational objective:
Convolutional Layer: This element executes mathematical convolutions by passing various analytical kernels across incoming imagery or antecedent feature representations, thereby constructing multifaceted feature maps that resolve the spatial hierarchy of the input data.
Pooling Layer: Positioned downstream from convolutional operations, these units downsample the emergent feature maps to compress spatial dimensions and economize network parameters. Prevailing architectures utilize max-pooling or average-pooling operations, which are indispensable for summarizing spatial data while preserving salient structural markers.
Fully Connected Layer: This component maps the aggregated hidden representations into a vector of predetermined dimensions, typically functioning as the terminal architecture for classification. However, its high topological density introduces a massive parameter footprint, demanding substantial computational overhead during optimization phases.
To tailor the prototypical CNN framework for specialized diagnostic targets and heightened performance, researchers have introduced numerous architectural refinements. These structural permutations have given rise to prominent lineages such as Inception, Xception, and ResNet. In the current investigation, six discrete deep learning paradigms—VGG19, InceptionV3, ResNet-50, Xception, MobileNetV2, and NASNetLarge—were selected to categorize brain malignancies from magnetic resonance imaging (MRI) data. The inclusion of these specific networks is justified by their validated empirical success and ubiquity in computer vision applications. Their divergent architectural methodologies and operational profiles ensure a robust comparative assessment regarding their utility in classifying brain tumors.
The VGG19 topology is highly regarded for its architectural clarity and systematic approach to object classification tasks. The framework is organized around 16 convolutional layers interspersed with pooling operations, culminating in 3 fully connected layers that together yield a footprint of 20 million parameters. Despite its architectural straightforwardness, VGG19 frequently yields classification accuracies that outrival more intricate topologies.
InceptionV3 represents a prominent CNN configuration engineered specifically for image categorization pipelines. Constructed by enhancing the foundational Inception module, it links successive blocks of convolutional, pooling, and dense layers, while incorporating dropout regularizers to mitigate the threat of overfitting. Configured with 42 operational layers and a parameter ensemble totaling 21.8 million, InceptionV3 serves as a highly resilient option for varied image-space tasks [33].
ResNet, or Residual Network, is a deep learning framework celebrated for delivering exceptional precision in image recognition benchmarks, having secured the top rank in the 2015 ILSVRC tournament [34]. As illustrated in Figure 6, ResNet-50—a specific 50-layer variant of this family—is constructed from 49 convolutional layers paired with a terminal fully connected layer, yielding 23.6 million optimization parameters. It successfully circumvents the vanishing gradient phenomenon by utilizing shortcut or "skip" connections.
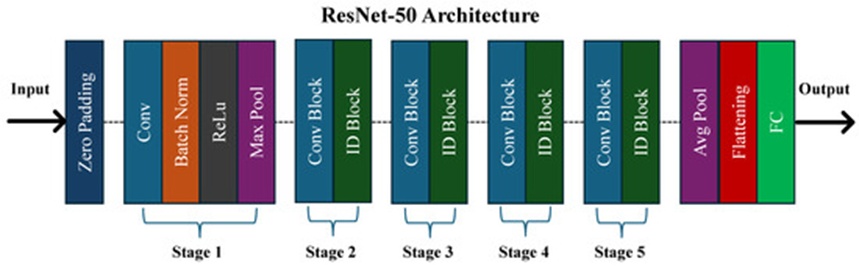
Figure 6. The architecture of the ResNet-50 model.
Introduced by Chollet in 2017, the Xception CNN framework reimagines standard convolutions by utilizing pointwise and depthwise separable convolutional methodologies [35]. The model features 71 layers distributed across an entry flow, a middle flow, and an exit flow. In a departure from classical designs, Xception avoids computing channel-wide and spatial-wide correlations simultaneously; this strategic separation limits internal network dependencies, effectively scaling down its parameter volume to approximately 21 million.
MobileNetV2 is characterized by an exceptionally lean topology that utilizes pointwise and depthwise convolutions to expedite processing velocities. Computational efficiency is enhanced further via residual connections flanking its bottleneck structures. The network initiates with a 32-filter convolutional layer before transitioning through a series of 19-filter bottleneck layers, a design that maximizes processing throughput without sacrificing model fidelity [36]. Aggregating roughly 2.2 million parameters, MobileNetV2 strikes a harmonious balance between operational speed and architectural complexity, making it uniquely suited for deployment environments defined by real-time inference constraints and hardware limitations.
NASNetLarge is a prominent CNN architecture distinguished by its massive scale and topological intricacy, designed primarily to maximize classification accuracy. Within its expansive framework, NASNetLarge coordinates 88 convolutional layers alongside global average pooling layers, encompassing roughly 84.9 million learnable parameters [37]. This network relies fundamentally on reinforcement learning-driven neural architecture search protocols to optimize its layout, ensuring robust performance across diverse imaging domains.
As schematized in Figure 7, this study utilizes transfer learning by seeding the initialization phase of the brain tumor classification models with weights derived from the ImageNet corpus. ImageNet constitutes a massive visual database containing over 14 million annotated, high-resolution photographs spanning more than 20,000 distinct conceptual classifications. It functions primarily as a benchmark for training and validating computer vision systems, particularly within image categorization research [38].
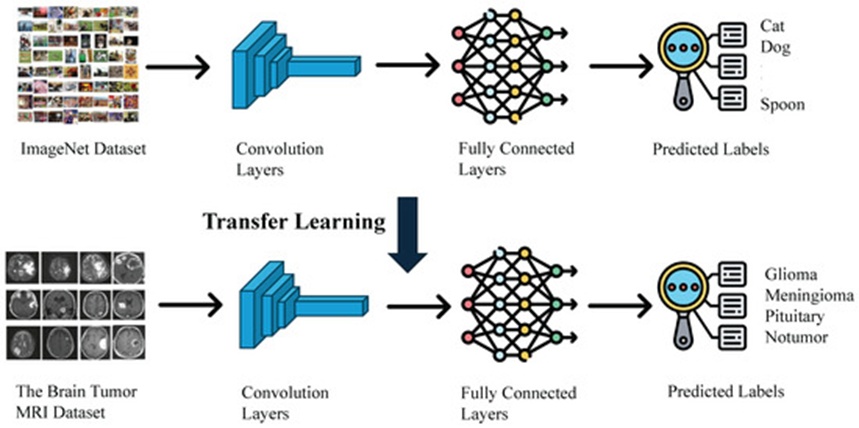
Figure 7. The transfer learning process leveraging imagenet pre-training.
The pre-trained coefficients acquired by optimizing ResNet-50 on ImageNet include the parameters of its convolutional layers, Batch Normalization layers, and dense classification layers. Initiating the ResNet-50 model with these pre-established weights provides the system with a foundational mastery of elemental visual abstractions, including edges, textures, gradients, and geometric primitives. These fundamental features transcend any specific data environment and are highly transferable to disparate domains, such as clinical imaging. For the task of brain tumor classification, this initialization strategy is indispensable; it allows the model to bypass random weight initialization and begin optimization from a state of visual literacy, drastically reducing both the training duration and the volume of data required.
Additionally, clinical datasets focusing on intracranial malignancies are chronically limited in volume due to the ethical, legal, and logistical friction inherent to gathering patient neuroimaging data. Training an expansive network like ResNet-50 from scratch on an sparse dataset routinely induces catastrophic overfitting, wherein the model memorizes the training inputs but fails to generalize to novel clinical cases. Employing pre-trained weights allows the network to exploit the broad representational knowledge acquired from ImageNet, establishing a stable baseline that suppresses overfitting and improves generalized performance.
This initialization methodology accelerates optimization speeds for target classification pipelines and generally yields superior accuracy compared to training models from scratch with randomized parameters. In the specific context of brain tumor classification, this approach enables the system to differentiate between pathological states more rapidly and accurately, directly translating to more dependable diagnostic tools and enhanced patient prognoses. Consequently, utilizing pre-trained ImageNet weights is not merely a convenient optimization shortcut, but a structural necessity for training viable deep learning architectures within medical imaging frameworks.
Following model initialization using the ImageNet database, hyperparameter optimization is conducted to refine classification performance. These parameters are established prior to launching the training phase and are not learned directly from the underlying data; their configurations profoundly dictate overall model efficacy, as detailed in Table 3. Within the domain of brain malignancy identification, meticulous hyperparameter configuration is vital due to the intrinsic complexity and structural diversity of clinical neuroimaging data.
Table 3. The configuration of hyperparameters for the selected models.
Hyperparameter Setting | Assigned Value |
Initial Learning Rate | 1 × 10⁻⁴ |
Batch Size | 32 images |
Total Training Epochs | 25 |
Validation Split | 20% |
Dropout Rate | 0.4 |
Optimizer | Adam |
Output Layer Activation | Softmax |
Objective Function | Categorical Cross-Entropy |
The learning rate, established at 0.0001, serves as a primary example of this configuration. This variable dictates the step size the algorithm takes during weight optimization, carefully balancing rapid convergence against the danger of overshooting the global minimum. An appropriately selected learning rate guarantees that the model trains efficiently, ensuring steady descent toward lower error bounds without inducing structural oscillations or divergence. Within clinical image classification tasks where high precision is mandatory, fine-tuning this step size frequently distinguishes standard performance from optimal diagnostic accuracy.
Another critical hyperparameter is the dropout probability, which is fixed at 0.4. This mechanism functions as a regularizer, enhancing the model’s robust generalization by stochastically deactivating a designated percentage of neurons during each training pass. This intervention mitigates overfitting, a frequent obstacle in medical image analysis where annotated datasets are regularly constrained in size. By preventing the architecture from becoming overly customized to the training cohort, dropout ensures reliable generalization to novel, unseen diagnostic cases, thereby boosting real-world utility.
Supplementary hyperparameters, including batch size and the total training epochs, also exert a significant influence on performance. Throughout these experiments, the batch size was set to 32 and the total execution epoch limit was capped at 25. The choice of batch size governs both the stability of the optimization trajectory and the model's ultimate generalization limits. While smaller batch sizes introduce stochastic noise that can help the network escape local minima and generalize better, larger batch sizes typically offer more stable, accelerated gradient updates. The epoch count determines the frequency with which the network processes the entire training repository; this value must be carefully selected to avoid underfitting due to premature termination or overfitting due to excessive training.
Furthermore, when optimizing brain tumor classification systems, components such as the chosen optimizer, localized activation functions, and the topology of dense layers appended to the pre-trained base can all be systematically adjusted. The Adam optimizer was integrated into the proposed diagnostic framework because it delivers superior convergence characteristics for medical computer vision applications.
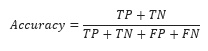
To thoroughly assess the diagnostic capabilities of the models during brain tumor classification, multiple statistical evaluation metrics were monitored. Confusion matrices (CM) were utilized to break down model predictions into true positives (TP), false positives (FP), true negatives (TN), and false negatives (FN). From these matrix outputs, foundational performance indicators—specifically accuracy, precision, recall, and the F1-score—were calculated to evaluate distinct dimensions of classification success.
Accuracy quantifies the overall correctness of the model's diagnostic assertions. It is computed as the proportion of correct classifications relative to the aggregate number of test cases, as formulated in Eq. 1.
In multi-class brain tumor categorization, an elevated accuracy metric demonstrates that the model successfully differentiates among various tumor pathologies. Nonetheless, this metric may fail to expose specific localized classification deficiencies, particularly when evaluating imbalanced datasets.
 (1)
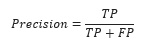
Precision evaluates the percentage of positive diagnostic assignments that are genuinely correct, as expressed in Eq. 2.
Achieving high precision is imperative for minimizing false positive classifications, which can prompt unnecessary diagnostic tests and unwarranted psychological distress for patients. This metric is especially crucial in clinical environments to prevent the misclassification of benign conditions as malignant tumors.
 (2)
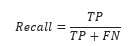
Recall (or sensitivity) quantifies the model's capacity to successfully identify all true positive instances within the dataset, as defined in Eq. 3.
Securing an elevated recall rate is vital for detecting as many genuine tumor cases as possible, particularly aggressive malignancies, to guarantee prompt therapeutic intervention and improve long-term patient prognoses.
 (3)
F1-Score
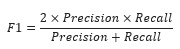
The F1-score delivers a balanced metric between precision and recall by determining their harmonic mean, as detailed in Eq. 4.
This indicator is exceptionally valuable when an analytical trade-off must be maintained between false positives and false negatives, offering a more complete and holistic perspective of overall model capability.
 (4)
Additionally, the computational duration required for a model to execute a diagnostic prediction (inference time) was recorded to verify its suitability for real-time clinical deployment. The training duration was also logged to evaluate how efficiently the models can be updated with fresh clinical data, thereby supporting both offline and online learning paradigms for adaptive healthcare technologies.
Deep neural networks utilizing CNN architectures have fundamentally transformed computer vision, achieving unprecedented success across multiple domains. However, their structural complexity and lack of decomposability into intuitively interpretable components make validating their internal logic a challenging task. In the context of deep learning-based brain tumor classification, interpretability and diagnostic transparency are paramount. Establishing clinical trust in these automated platforms requires architectures that can clarify the underlying logic governing their predictions. Transparent models reveal why specific image features are heavily weighted during classification, granting radiologists and researchers a clearer understanding of how the network analyzes MRI scans to differentiate between separate tumor types.
Gradient-weighted Class Activation Mapping (Grad-CAM) serves as a potent class-discriminative localization strategy that produces visual explanations for any CNN-based framework without demanding architectural alterations or model retraining [39]. This methodology exploits the gradient data routed into the terminal convolutional layer of a deep learning model, assigning an importance coefficient to each neuron relative to a specific classification outcome. Consequently, Grad-CAM graphically highlights the specific zones within the input image that exerted the greatest influence over the model's final prediction.
Interpretable Grad-CAM visualizations provide a clear window into the underlying logic of deep learning systems. For instance, if a network categorizes an MRI volume as a Glioma, Grad-CAM can visually isolate the exact regions of the scan the model scrutinized to reach that conclusion. These visual explanations are critical because they reveal whether the network is accurately focusing on the actual pathology or if its decision is being skewed by irrelevant features or imaging artifacts. By analyzing these visual heatmaps, clinicians can critically assess the reliability and fidelity of the model's output. This transparency is vital in medical settings, where understanding the foundation of an algorithmic decision ensures that the technology aligns directly with established clinical knowledge and expert expectations. Furthermore, Grad-CAM can highlight hidden blind spots within the model, guiding targeted modifications and iterative refinements to enhance its ultimate diagnostic accuracy.
The empirical evaluations were executed on a Dell Precision 3660 Tower server (Dell Technologies, Round Rock, TX, USA) configured with a 13th Generation Intel Core i9-13900 CPU (16 cores, 2.40 GHz), 64 GB of RAM, and an NVIDIA RTX A5000 GPU, operating under a Windows 11 environment. The software development framework incorporated PyCharm v2024.2.3 for source code modification and debugging, Anaconda v2.6.2 for Python environment and package administration, and Visual Studio Code v1.93.1 chosen for its architectural flexibility.
The machine learning architecture was constructed via Python programming, leveraging specialized libraries including Pandas for data manipulation, Matplotlib for graphical visualization, and Scikit-learn for execution of the core machine learning operations. To guarantee experimental reproducibility, an exhaustive inventory of the software dependencies and specific libraries is provided in the public GitHub repository [40].
The deep learning architectures designated for this investigation—specifically ResNet-50, VGG19, InceptionV3, NASNetLarge, MobileNetV2, and Xception—were selected due to their proven capabilities in image categorization and high efficacy in transfer learning paradigms. To establish an equitable baseline for the multi-class categorization of brain malignancies, every architecture underwent training utilizing a uniform configurations of hyperparameters (Table 3).
The scope of this research also encompassed investigating how diverse data preprocessing and augmentation strategies altered overall model capability. The networks were thoroughly validated on both the unaltered and the preprocessed image collections, alongside a focused exploration regarding the specific impacts of data augmentation on the ResNet-50 architecture.
The evaluation of model efficacy relied upon the subsequent performance metrics:
Training and Validation Accuracy: Utilized to determine the capacity of the model to generalize to unseen data.
Training and Validation Loss: Utilized to observe and track optimization convergence behavior.
Confusion Matrices (CMs) on Test Set: Utilized to acquire granular insights regarding specific classification errors.
Training Time: Utilized to measure overall computational efficiency.
Number of Model Parameters: Utilized to determine the structural complexity of each architecture.
Prediction Time: Utilized to verify applicability for deployment in real-time medical contexts.
To improve the interpretability of the deep learning black-box systems, the Gradient-weighted Class Activation Mapping (Grad-CAM) technique was applied to the ResNet-50 network, yielding visual evidence for its diagnostic outputs. This visualization mechanism assists medical experts in validating AI-driven diagnostic conclusions. Lastly, the top-performing network configuration was benchmarked against prior literature utilizing the identical dataset to demonstrate its advantages and outline prospective enhancements.
Table 4 outlines the performance indicators recorded for the various architectures, and Figure 8 presents their respective confusion matrices. A comparative review of these outcomes highlights that ResNet-50, Xception, and InceptionV3 perform exceptionally well in multi-class brain tumor identification, with each network reaching approximately 99% across accuracy, precision, recall, and F1-score dimensions for the four separate tumor categories. Furthermore, VGG19, MobileNetV2, and NASNetLarge display reliable performance, maintaining classification accuracy metrics above the 95% threshold.
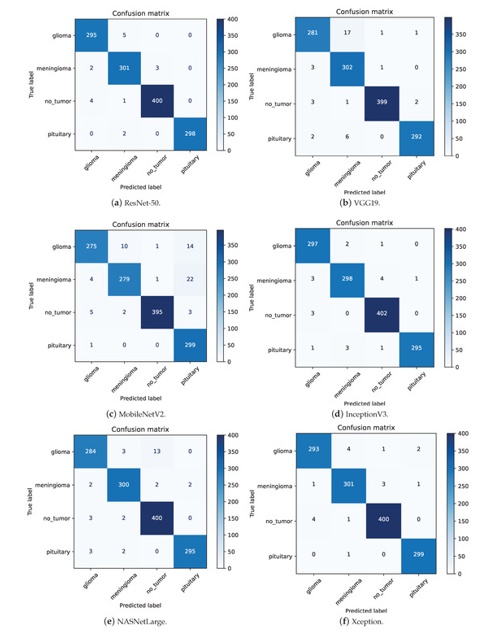
Figure 8. The confusion matrices for different models.
Table 4. The comparison of different models in terms of different classification metrics.
Network Architecture | Tumor Category | Overall Accuracy | F1 Measure | Sensitivity (Recall) | Precision |
ResNet-50 (Without Augmentation) | Glioma |
| 0.91 | 0.99 | 0.84 |
Meningioma |
| 0.87 | 0.77 | 0.99 | |
No-tumor | 93.14% | 0.96 | 0.99 | 0.94 | |
Pituitary |
| 0.97 | 0.97 | 0.97 | |
Weighted Average |
| 0.93 | 0.93 | 0.94 | |
MobileNetV2 | Glioma |
| 0.94 | 0.92 | 0.96 |
Meningioma |
| 0.93 | 0.91 | 0.96 | |
No-tumor | 95.15% | 0.99 | 0.98 | 0.99 | |
Pituitary |
| 0.94 | 1.00 | 1.00 | |
Weighted Average |
| 0.95 | 0.95 | 0.95 | |
VGG19 | Glioma |
| 0.95 | 0.94 | 0.97 |
Meningioma |
| 0.96 | 0.99 | 0.93 | |
No-tumor | 97.18% | 0.99 | 0.99 | 1.00 | |
Pituitary |
| 0.98 | 0.97 | 0.99 | |
Weighted Average |
| 0.97 | 0.97 | 0.97 | |
NASNetLarge | Glioma |
| 0.96 | 0.95 | 0.97 |
Meningioma |
| 0.98 | 0.98 | 0.98 | |
No-tumor | 97.56% | 0.98 | 0.99 | 0.96 | |
Pituitary |
| 0.99 | 0.98 | 0.99 | |
Weighted Average |
| 0.98 | 0.98 | 0.98 | |
InceptionV3 | Glioma |
| 0.98 | 0.99 | 0.98 |
Meningioma |
| 0.98 | 0.97 | 0.98 | |
No-tumor | 98.55% | 0.99 | 0.98 | 1.00 | |
Pituitary |
| 0.99 | 0.99 | 0.99 | |
Weighted Average |
| 0.99 | 0.99 | 0.99 | |
Xception | Glioma |
| 0.98 | 0.98 | 0.98 |
Meningioma |
| 0.98 | 0.98 | 0.98 | |
No-tumor | 98.63% | 0.99 | 0.99 | 0.99 | |
Pituitary |
| 0.99 | 0.99 | 0.99 | |
Weighted Average |
| 0.99 | 0.99 | 0.99 | |
ResNet-50 | Glioma |
| 0.98 | 0.98 | 0.98 |
Meningioma |
| 0.98 | 0.98 | 0.97 | |
No-tumor | 98.70% | 0.99 | 0.99 | 0.99 | |
Pituitary |
| 1.00 | 0.99 | 1.00 | |
Weighted Average |
| 0.99 | 0.99 | 0.99 |
The ResNet-50 model demonstrates its lowest precision score of 0.97 when identifying Meningiomas. As illustrated in Figure 8a, among 309 scan instances classified as Meningioma, 301 were accurately diagnosed. Within the 8 erroneously assigned cases, 5 were misclassified as Glioma, 2 as Pituitary, and 1 as a healthy non-tumor control. This elevated precision rate emphasizes the capacity of the network to reliably differentiate Meningiomas from alternative pathological classes, despite its marginally lower score relative to other categories. Similarly, InceptionV3 exhibits a recall rate of 0.97 for the Meningioma class. Reviewing the confusion matrix in Figure 8d, from 306 true "Meningioma" images, 298 were accurately identified. The underlying misclassifications were limited, with 3 "Meningioma" samples mistakenly labeled as "Glioma" and 4 instances miscategorized as "No-tumor". This demonstrates robust diagnostic capability, given that the aggregate misclassifications are minimal, reinforcing the general capacity of the model to correctly identify these malignancies.
A detailed inspection of the confusion matrices for ResNet-50, Xception, and InceptionV3 uncovers specific shared diagnostic errors. Particularly, ResNet-50 incorrectly assigned a "Glioma" label to 4 healthy "No-tumor" scans, whereas Xception and InceptionV3 made this exact error on 4 and 3 healthy scans, respectively. Figure 9 highlights that 3 specific "No-tumor" imaging samples were systematically misidentified as "Glioma" by all three networks, with InceptionV3 exclusively classifying every misdiagnosed "No-tumor" instance from this cohort into the "Glioma" category.
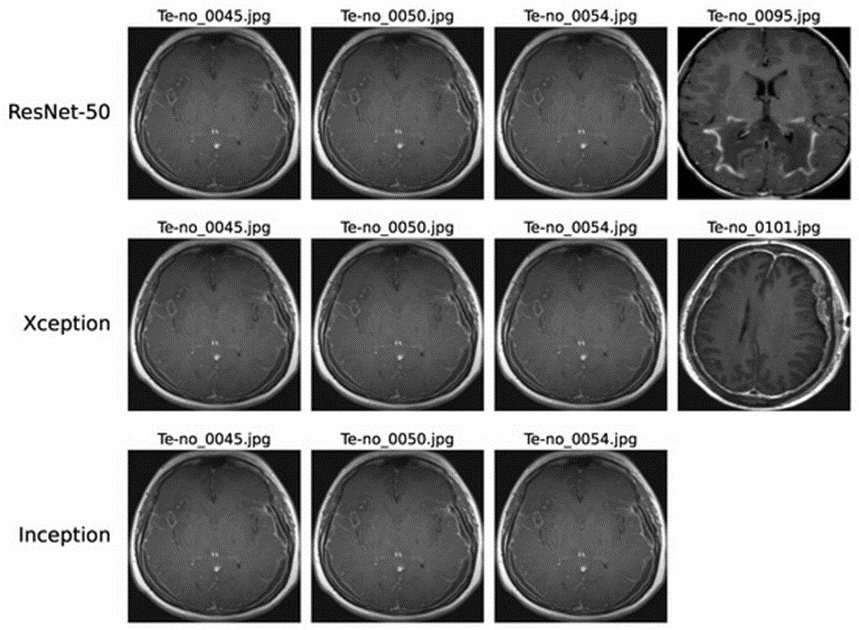
Figure 9. Instances of no-tumor images misdiagnosed as Glioma on ResNet-50, Xception, and InceptionV3 models.
These classification errors can be linked to several technical and clinical variables. The high structural complexity of these deep networks may sometimes constrain their proficiency in extracting highly subtle patterns from magnetic resonance imaging (MRI) slices. Experimental factors such as diminished spatial resolution or motion-blur artifacts can hinder robust feature extraction, thereby impacting overall classification precision. Furthermore, structural artifacts or random noise inherent to MRI acquisitions can introduce ambiguity, complicating the interpretation of visual information by the models. In addition, distinguishing early-stage Glioma manifestations from normal, non-tumor MRI scans presents a significant diagnostic hurdle due to the minimal visible changes present in the anatomy.
The comparative error assessment illustrated in Figure 10 indicates that ResNet-50, Xception, and InceptionV3 generated misclassifications in 17, 18, and 19 images, respectively. Notably, a substantial portion of the errors produced by Xception and InceptionV3 occurred on identical images, showcasing parallel performance trends between these two networks on the evaluation data. This prominent overlap in failure modes is likely due to the historical development of Xception as a direct architectural extension of the Inception design. Xception refines the original Inception framework by utilizing depthwise separable convolutions, thereby retaining substantial structural alignment with InceptionV3. This architectural commonality explains why the two models manifest equivalent error distributions on the same image instances. Furthermore, 6 specific scans were uniformly misclassified across all three models, highlighting systemic challenges that transcend individual network designs. Conducting more granular assessments is essential to isolate the precise triggers for these common errors, which will supply deeper insights and facilitate the formulation of target mitigations. Such rigorous error tracking is fundamental to maximizing diagnostic consistency in intricate applications like multi-class brain tumor sorting.
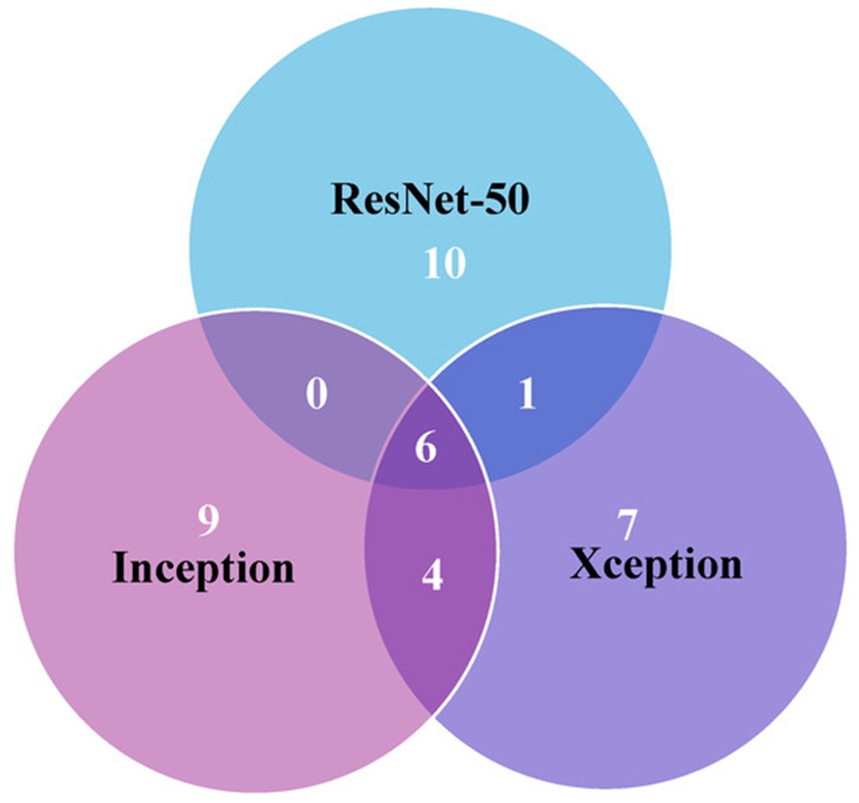
Figure 10. Error analysis among ResNet-50, Xception, and InceptionV3 models.
The convergence trajectories of ResNet-50, Xception, and InceptionV3 are clearly depicted in the accuracy and loss curves shown in Figure 11. These architectures exhibit rapid optimization, frequently reaching stable plateaus in fewer than five training epochs. This rapid convergence shows that these systems demand shorter training durations, which can minimize total computational costs and resource use—a highly beneficial characteristic for large-scale clinical deployment in neuro-oncological imaging. Conversely, the VGG19 network exhibits a prolonged convergence path, generally requiring 10 to 15 epochs to stabilize. This prolonged optimization period increases the need for hardware resources and yields lower overall accuracy compared to the top-performing networks.
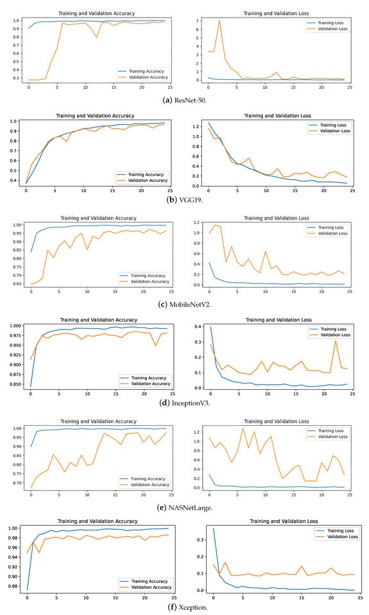
Figure 11. The accuracy and loss plots for different models.
MobileNetV2 and NASNetLarge display noticeable oscillations within their training curves, failing to achieve steady convergence even after 25 training epochs. This difficulty in reaching stability during the optimization phase matches their diminished accuracy metrics on the evaluation dataset. These observations imply that such models may be less optimal for the rigorous constraints of brain tumor categorization owing to their unstable behavior during training.
Table 5 details the correlation linking the total model parameters, requisite training duration, and resulting classification accuracy across the evaluated networks. MobileNetV2 distinguishes itself by its highly compact design of 2.2 million parameters and a brief training time of 101 min, while achieving an accuracy score above 95%. These qualities make it exceptionally well-suited for deployments characterized by restricted computational resources and narrow time windows, even though its peak accuracy falls short of the premier results produced by heavier models such as ResNet-50 and Xception.
Table 5. Comparison of different models in terms of number of parameters.
Deep Learning Model | Classification Accuracy | Training Duration | Parameter Count (Millions) |
MobileNetV2 | 95.19% | 101 | 2.2 |
VGG19 | 97.18% | 498 | 20.0 |
Xception | 98.63% | 217 | 20.8 |
InceptionV3 | 98.55% | 104 | 21.8 |
ResNet-50 | 98.70% | 162 | 23.6 |
NASNetLarge | 97.56% | 1188 | 84.9 |
In contrast, NASNetLarge exhibits the greatest structural complexity, containing 84.9 million parameters and demanding an extended training runtime of 1188 min. Although it delivers a high accuracy score of 97.56%, its massive footprint presents distinct liabilities regarding computational throughput and susceptibility to overfitting, which narrows its suitability for real-world scenarios that demand simultaneous operational speed and generalizability.
Figure 12 displays the performance profiles of ResNet-50, Xception, and InceptionV3, each of which is built with slightly above 20 million parameters and secures an accuracy rate near 99%. These networks demonstrate an effective compromise between parameter count, training latency, and diagnostic accuracy, exhibiting lower structural complexity and quicker training phases relative to NASNetLarge. More specifically, InceptionV3 requires a training runtime of 104 min, an interval nearly identical to the 101 min required by MobileNetV2. Despite this close correspondence in training time, the parameter volume of InceptionV3 is tenfold larger than that of MobileNetV2. This demonstrates that InceptionV3 can match the performance tiers of alternative high-capacity models while maintaining an efficient training timeline. Conversely, Xception requires 217 min to complete its training cycle, reflecting the added computational overhead inherent to its specific design. Consequently, InceptionV3 showcases a clear advantage in training speed relative to its parameter density and classification throughput.
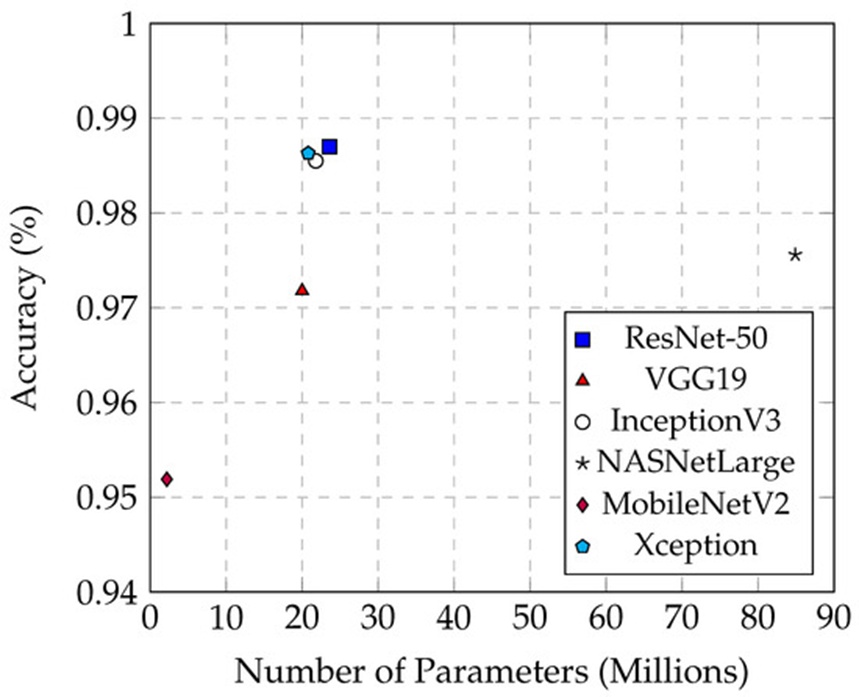
Figure 12. The relationship between accuracy and the number of parameters across different models.
Inference latency represents a vital parameter for the practical deployment of brain malignancy classification frameworks. Within clinical workflows, shorter inference periods enable rapid diagnostic determination and improve patient care pathways. Models characterized by brief prediction times are naturally favored for integration within medical visualization software where real-time diagnostics are required.
Table 6 details the average, maximum, and minimum prediction latencies (expressed in milliseconds) documented for each network across the complete testing dataset. Among these observations, the mean prediction latency serves as the most informative and indicative metric for comparison.
Table 6. Comparison of different models in terms of prediction time (ms).
Model | Avg. Time (ms) | Max. Time (ms) | Min. Time (ms) |
MobileNetV2 | 40.6 | 199.3 | 37.4 |
InceptionV3 | 53.7 | 203.2 | 39.4 |
Xception | 84.9 | 254.1 | 74 |
ResNet-50 | 90.1 | 249.1 | 76.5 |
VGG19 | 128.6 | 301.1 | 97.9 |
NASNetLarge | 329 | 537.4 | 260 |
The scale of a network's parameter profile directly governs its inference speed. MobileNetV2, with its minimal footprint of 2.2 million parameters, illustrates the structural advantages of a lightweight architecture regarding execution velocity. It registers the lowest mean prediction latency at 40.6 ms while sustaining a classification accuracy of 95.15%. This efficiency stems directly from its optimized structural composition, which markedly shortens inference cycles. Such performance attributes render MobileNetV2 highly compatible with frameworks where instantaneous output is mandatory, such as point-of-care diagnostics.
At the opposite end of the performance spectrum, NASNetLarge records the longest average prediction latency at 329 ms, exceeding the maximum individual inference times documented for all other five networks, despite achieving a 97.56% accuracy level. The massive parameter allocation of NASNetLarge drives its high complexity and physical scale, markedly prolonging its inference cycles. While a dense parameter distribution can potentially boost classification accuracy by mapping more elaborate image features, it simultaneously increases computational overhead and slows inference throughput. This fundamental engineering trade-off is apparent in NASNetLarge; despite its strong classification metrics, its substantial prediction latency makes it less optimal for real-time diagnostic systems.
As illustrated in Figure 13, InceptionV3 provides shorter average prediction latencies compared to the remaining top-tier networks, namely ResNet-50 and Xception. While delivering equivalent diagnostic accuracy levels, InceptionV3 operates with a mean prediction latency of just 53.5 ms, whereas Xception requires an average of 84.9 ms and ResNet-50 takes an average of 90.1 ms. These architectures prove that excellent classification performance can be attained without incurring prohibitive computational delays during inference, rendering them ideal candidates for deployment in clinical medical imaging systems. Their balanced equilibrium of high accuracy and operational efficiency is vital for facilitating real-time diagnosis and rapid clinical decision-making.
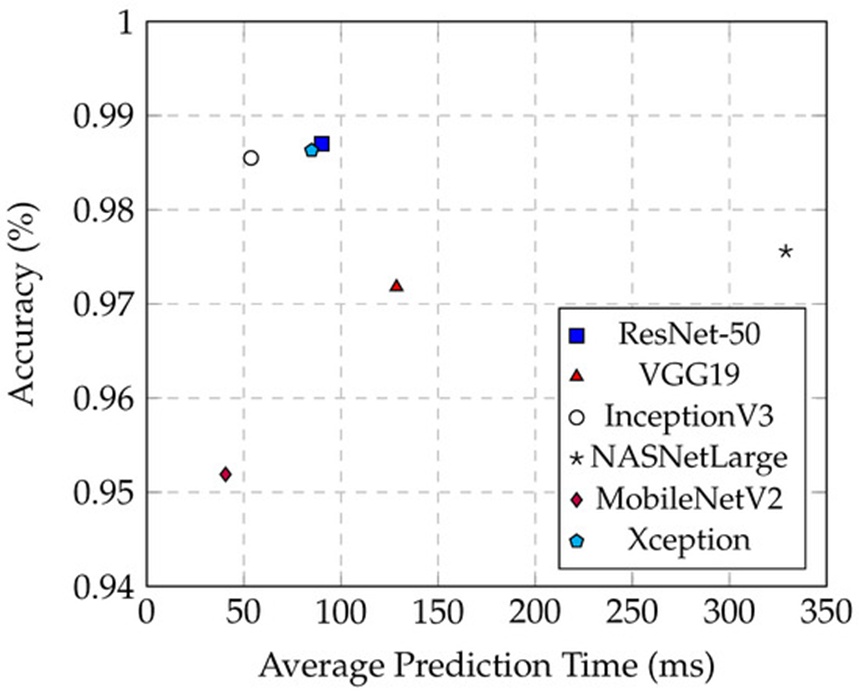
Figure 13. The relationship between the accuracy and the average prediction time in different models.
As illustrated in Figure 14, the classification performance of multiple architectures was evaluated across both the baseline and preprocessed test frameworks. The results indicate that implementing preprocessing operations—specifically localized cropping and noise mitigation—led to substantial performance gains. On average, these data-refinement workflows yielded an approximate 10% elevation in accuracy. A particularly prominent shift was observed in MobileNetV2, which climbed from an initial baseline of 72.08% to a post-processing high of 95.19%, representing a definitive 23% expansion in accuracy.
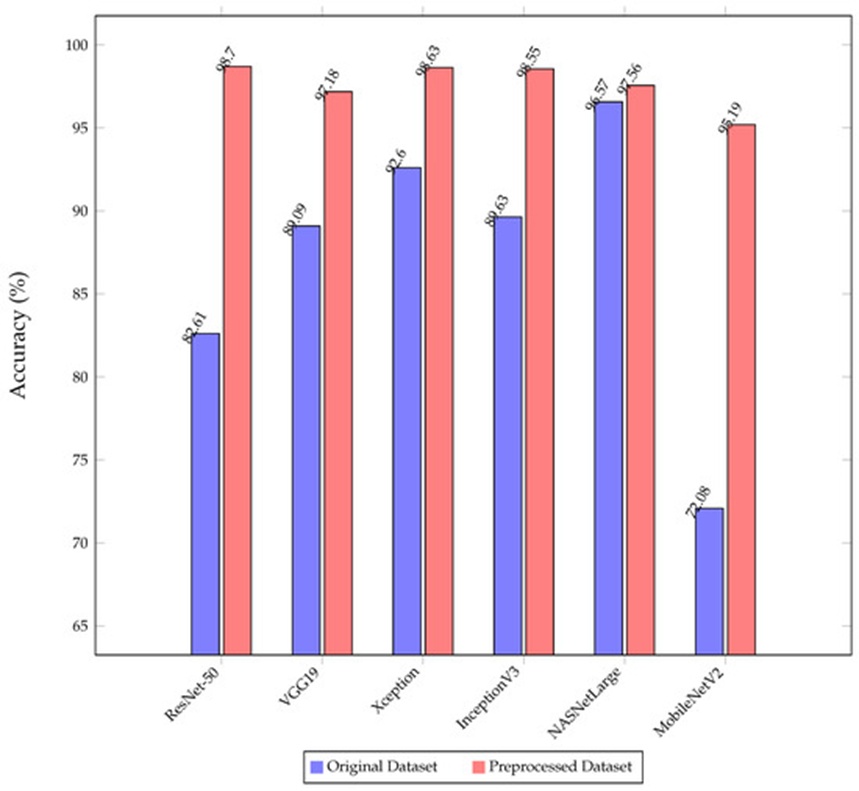
Figure 14. The comparison of the classification accuracy of the proposed models on the original and preprocessed dataset.
Characterized by a highly streamlined framework encompassing merely 2.2 million parameters, MobileNetV2 inherently lacks the capacity to effectively isolate critical target features when processing unrefined datasets, as it is highly susceptible to background artifacts. Conversely, the introduction of preprocessing operations drastically elevates data fidelity by constraining the region of interest to the cerebral envelope and suppressing extraneous noise. This intervention markedly bolsters the network’s capacity to preserve and interpret vital structural information with high fidelity.
On the other hand, NASNetLarge exhibited virtually static accuracy across both data environments, as shown in Figure 14. This uniform behavior is largely driven by its massive architectural footprint, which leverages more than 80 million parameters to effectively extract essential diagnostic indicators directly from unconditioned inputs, showcasing exceptional feature learning capability. Nevertheless, it must be emphasized that NASNetLarge demands vastly extended training and inference phases relative to competing pipelines. This computational overhead serves as a pivotal constraint in real-world clinical deployments where operational throughput is critical.
The diagnostic confusion matrix is detailed in Figure 15, while the corresponding training accuracy and objective loss trajectories for ResNet-50 running without data augmentation are mapped in Figure 16. Absent any dataset augmentation, the ResNet-50 variant converged at an accuracy of 93.14%, whereas the integration of augmentation strategies elevated this metric to 98.70%. This notable margin of improvement emphasizes the utility of synthetic data expansion in optimizing network performance for multi-class cerebral malignancy differentiation.
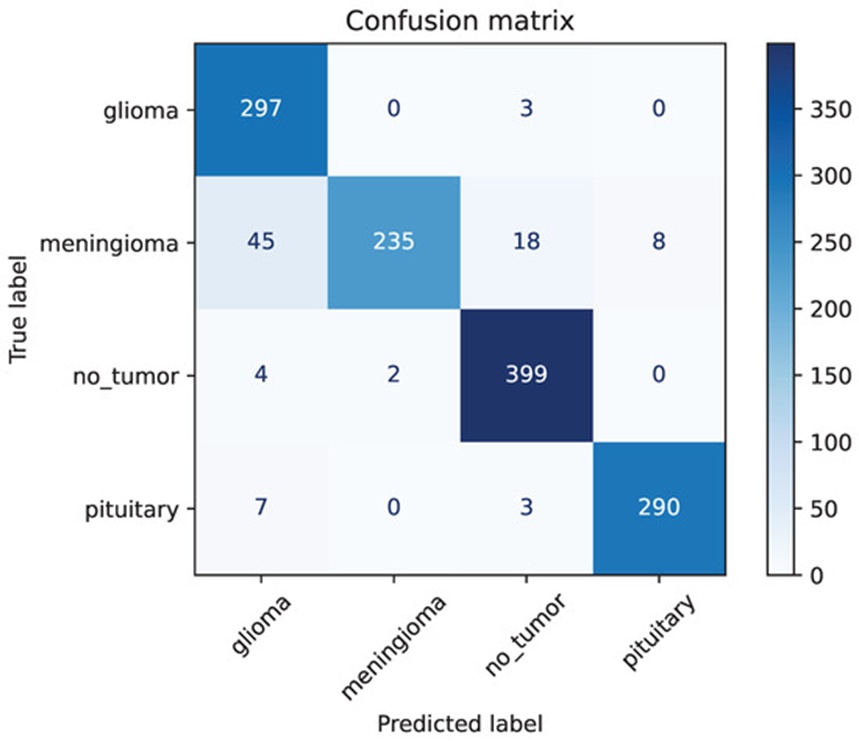
Figure 15. The confusion matrix of ResNet-50 without image augmentation.
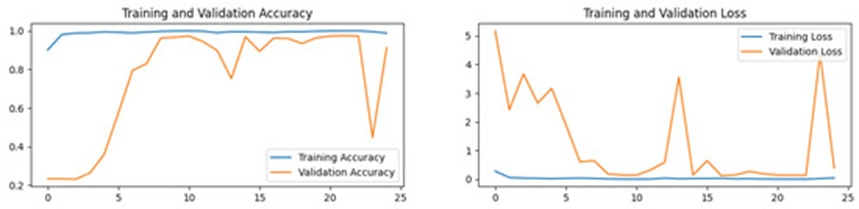
Figure 16. The accuracy and loss plot of ResNet-50 without image augmentation.
When operating without data expansion, the ResNet-50 model achieved a recall score of merely 0.84 for the Glioma cohort, representing its weakest class-specific performance. According to the matrix in Figure 15, the network successfully isolated 297 true positive instances out of 353 true Glioma samples; however, it incorrectly labeled 45 Meningioma samples as Glioma. Similarly, the unaugmented ResNet-50 model yielded its lowest precision score for the Meningioma category, registering at just 0.77. Within a total sample pool of 306 Meningioma instances, only 235 were correctly diagnosed, whereas 45 were misclassified as Glioma, 18 as healthy tissue (No-tumor), and 8 as Pituitary abnormalities. These findings demonstrate that the primary operational bottleneck of the unaugmented ResNet-50 model stems from its struggle to confidently delineate Meningioma signatures, resulting in widespread misclassification across competing diagnostic categories.
This evaluation underscores the mandatory role played by image augmentation in stabilizing and refining model classification boundaries. These expansion methods not only elevate the generalized accuracy of the network but also significantly strengthen its capacity to resolve highly ambiguous pathological classes, specifically Meningioma and Glioma. Furthermore, the sustained high performance achieved by ResNet-50, Xception, and InceptionV3 when paired with data augmentation highlights the necessity of using such workflows to construct dependable, multi-class clinical diagnostic tools.
Figure 17 illustrates the spatial interpretation of the classification pathways utilized by ResNet-50 during brain tumor evaluation. For this demonstration, a baseline MRI slice containing a verified Meningioma mass was utilized, as shown in Figure 17a. The scan exhibits a distinct hyperintense region located in the right hemisphere of the brain, pinpointing the exact position of the Meningioma. Figures 17b–17f display the progressive activation heatmaps derived from each successive stage of the ResNet architecture. A clear, incremental focus of color intensity is visible localized within the pathological zone, while activation declines across non-diagnostic tissues. This gradient shift illustrates the step-by-step feature prioritization that guides the ResNet-50 architecture toward its final diagnostic output. This visual telemetry not only clarifies how the network isolates and categorizes abnormal tissues but also provides explicit visibility into the regional features driving its inferences.
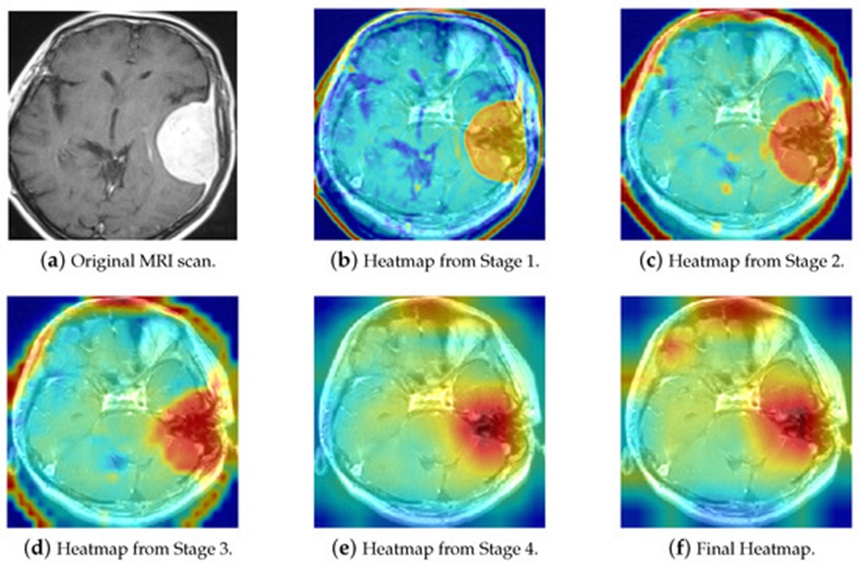
Figure 17. The Grad-CAM visualization of ResNet-50 decision pathways in brain tumor classification.
Figure 18 presents three examples of accurately diagnosed Glioma scans paired alongside three healthy control (No-tumor) MRIs that were mistakenly classified as Glioma by the system. To decode these specific decision-making vulnerabilities within ResNet-50, a Grad-CAM mapping was executed. The visualizations reveal that when predicting a Glioma outcome, ResNet-50 consistently shifts its focus to the cranial perimeter of the brain scan, mirroring the activation patterns seen in true Glioma instances. Because the three misclassified healthy control images also displayed prominent structural features along the cranial borders, they generated similar heatmap weights, thereby causing the model to generate false positive Glioma labels. Comparative anatomical reviews of these scans confirm that strong structural similarities exist between specific healthy perimeters and Glioma boundaries, presenting a persistent classification challenge across multiple deep learning frameworks.
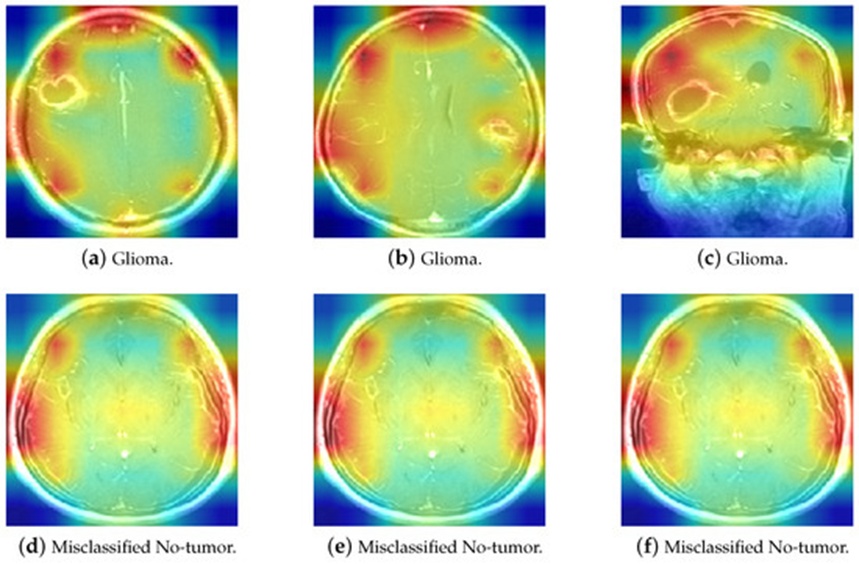
Figure 18. The comparison of Glioma and misclassified No-tumor MRI heatmaps.
Integrating Grad-CAM into clinical computer-aided diagnostics offers massive operational advantages by resolving the black-box nature of deep learning systems. By providing explicit spatial maps of the distinct MRI regions driving network predictions, Grad-CAM allows radiologists to systematically audit and corroborate the machine’s diagnostic rationale. This degree of verification not only validates multi-class tumor categorization but also establishes the foundation required to deploy resilient, highly dependable clinical systems. In real-world environments, the intuitive spatial evidence generated by Grad-CAM allows clinical teams to execute treatment planning with greater confidence, knowing it is backed by verifiable AI reasoning. By identifying which anatomical features the model prioritizes during feature extraction, clinicians can seamlessly integrate automated predictions into daily hospital operations. This synergy optimizes triage timelines and ensures patients undergo rapid, highly accurate clinical assessments, paving the way for early therapeutic intervention. Furthermore, the generation of transparent decision maps builds deep trust in AI tools among medical staff and patients alike. By explaining complex neural networks in a clear, visual format, Grad-CAM encourages multidisciplinary clinical collaboration and maximizes overall patient care.
An operational Brain Tumor Detection System has been implemented via Python and Streamlit, with the source code hosted within a public GitHub repository (Zhengkun, 2024, [40]). This platform is structured to automatically triage MRI inputs into four distinct classes: Meningioma, Glioma, Pituitary tumors, or healthy control states (No-tumor). The core mission of this application is to support clinical practitioners by delivering clear, real-time spatial maps of the underlying deep learning decision pathways.
This interactive web interface not only simplifies precise pathology classification but also uncovers the intrinsic logic used by the deep neural network. By combining sophisticated computer vision backends with accessible front-end visualization utilities, the software provides healthcare specialists with the evidence needed to finalize rapid, data-driven diagnostic assessments.
In practical clinical environments, this application serves as an essential secondary decision-support pipeline for medical practitioners. Upon uploading an ambiguous MRI scan to the “Disease Recognition” interface (illustrated in Figure 19), the platform activates its deep learning pipeline, which is optimized to accurately isolate Meningioma, Glioma, and Pituitary pathologies from healthy variations. When the operator triggers the “Predict” command, the system processes the input image near-instantaneously, returning granular class assignments alongside corresponding probabilistic confidence margins.
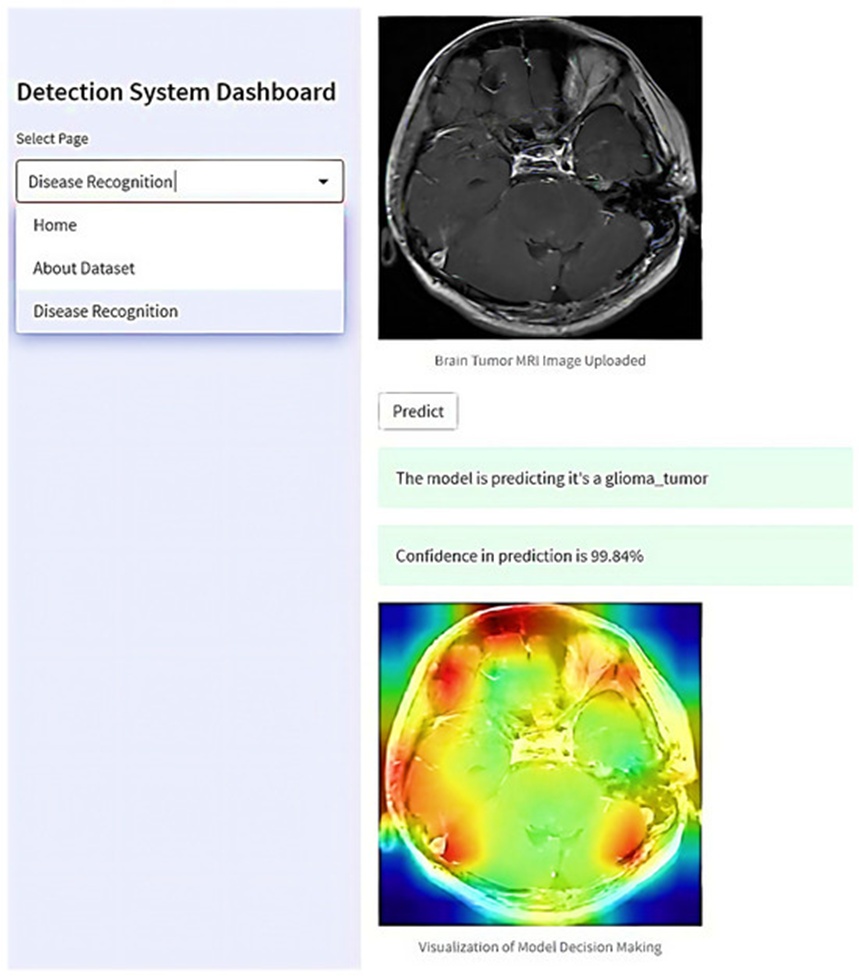
Figure 19. The proposed web-based interactive application for real-world brain tumor detection.
Concurrently, the application builds visual explanations that map the underlying logic of the computer vision decision. These graphical heatmaps explicitly indicate which coordinate sectors of the MRI slice commanded the heaviest weighting during classification. This real-time transparency broadens the doctor's grasp of the automated diagnosis and helps streamline multidisciplinary diagnostic reviews.
By presenting automated insights in a readable, highly transparent format, the platform supports collaborative medical review. Separate specialists can simultaneously evaluate identical spatial maps and prediction distributions, pooling their diagnostic perspectives to formulate unified, highly targeted patient treatment plans. This unified clinical workflow not only safeguards diagnostic fidelity but also ensures that subsequent therapeutic actions leverage the collective knowledge of the entire medical staff. Consequently, the proposed application serves as an essential tool for boosting diagnostic reliability and improving final patient recovery outcomes.
The data compiled in Table 7 provides an exhaustive comparative evaluation matching the top-tier configurations of five historical benchmark papers against the performance metrics established in this research. To guarantee a strictly reliable and valid baseline of comparison, every referenced study used the identical Brain Tumor MRI Dataset. The performance indices quoted for these five benchmark papers reflect their final validation outputs across the full test distribution, encompassing standardized metrics including accuracy, precision, recall, and F1-score. This multi-dimensional comparison illuminates the architectural boundaries and benefits of each methodology, offering clear insight into the capabilities of different neural network architectures for MRI-based brain tumor screening.
Table 7. A comparative analysis of the best model with state-of-the-art models using the same dataset.
Author(s) and Year | Models | Average Inference Time (ms) | Training Time (Minutes) | Accuracy | F1-Score | Recall | Precision |
Alnemr et al., 2021 [41] | ResNet152V2 | - | - | 98.9% | - | - | - |
Rauf et al., 2022 [42] | DCST + SVM | - | - | 97.71% (binary) | 0.972 | 0.966 | 0.978 |
Gómez-Guzmán et al., 2023 [43] | InceptionV3 | - | 323 | 97.12% | 0.9727 | 0.9659 | 0.9797 |
Özkaraça et al., 2023 [44] | Dense CNN | - | - | 94%-97% | 0.96 | 0.965 | 0.96 |
Shilaskar et al., 2023 [45] | HOG-XG Boost | - | - | 92.02% | 0.9185 | 0.9182 | 0.9207 |
Rasheed et al., 2023 [46] | Improved CNN | 830 | - | 97.84% | 0.979 | 0.9785 | 0.9785 |
Celik et al., 2023 [47] | CNN+KNN | - | 67 | 97.15% | 0.97 | 0.97 | 0.97 |
Proposed method | Modified ResNet-50 | 90.1 | 162 | 98.7% | 0.99 | 0.99 | 0.99 |
Alnemr et al. [41] (2021) deployed a modified, pre-trained ResNet152V2 engine combined with basic dataset augmentation workflows to classify brain tumors, registering a peak accuracy of 98.9%. Nonetheless, their document lacks complete metric tracking, leaving out specific precision, recall, and F1-score values, while omitting comprehensive descriptions of their hardware and software environments. Furthermore, because their source code remains unreleased, reproducing their exact results is highly difficult, limiting the scientific reproducibility of their assertions.
Rauf et al. [42] (2022) combined Discrete Cosine-based Stockwell Transforms (DCST) for spatial feature extraction with a Support Vector Machine (SVM) backend to execute binary classification, separating tumor samples from non-tumor scans with an accuracy of 97.71%. Although their system successfully classified heterogeneous brain tumor imagery on a binary scale, their methodology failed to differentiate between specific pathological sub-types.
Gómez-Guzmán et al. [43] (2023) scrutinized seven deep convolutional network frameworks, reporting a top accuracy of 97.12% via the InceptionV3 network. However, their manuscript omits a direct, standardized cross-comparison of models on unified test sets and does not provide an open-source code repository, which limits third-party validation. In contrast, our implementation of parallel architectures (including ResNet-50, InceptionV3, and Xception) achieved higher top-tier accuracies, validating the superior efficiency and resilience of our deployed training framework.
Özkaraça et al. [44] (2023) engineered a novel modular neural network that merged components from DenseNet, VGG16, and foundational CNN blocks for MRI categorization, achieving enhanced diagnostic capacity but at the expense of high computational latency. Their composite network yielded an accuracy of 94%, which sits below the performance of our lowest-scoring standalone baseline, MobileNetV2, highlighting room for structural optimization.
Shilaskar et al. [45] (2023) leveraged classical MRI preprocessing workflows paired with Histograms of Oriented Gradients (HOG) for feature isolation, passing these inputs to standard machine learning classifiers like SVM, Gradient Boosting, KNN, XGBoost, and Logistic Regression to achieve a maximum classification accuracy of 92.02%. This 92% ceiling indicates a noticeable performance disparity compared to modern deep learning implementations in the field.
Regarding computational latency during deployment, Table 7 reveals that our methodology delivers faster inference throughput than the framework designed by Rasheed et al. (2023) [46]. This operational speedup occurs because their pipeline relies heavily on deep, sequential preprocessing workflows, which add significant computational overhead and processing delays during live inference. Conversely, our architecture reduces these operational dependencies, ensuring a highly streamlined and rapid inference pipeline.
When evaluating training times, a direct, equitable comparison across different publications is impossible due to several distinct variables. First, a large portion of previous studies, including the work by Rasheed et al., fail to explicitly report total training runtimes. Second, severe variations in hardware configurations and computational environments across separate research groups render any direct time comparisons statistically invalid. Consequently, training latency metrics remain purely standalone observations.
This investigation orchestrates an advanced suite of methodologies—encompassing raw data preprocessing, automated hyperparameter optimization, dynamic image augmentation, and Grad-CAM spatial mapping—across core architectures like ResNet-50, Xception, and InceptionV3 to secure exceptional classification performance. The optimized ResNet-50, Xception, and InceptionV3 variants all converged at elite accuracy boundaries nearing 99%. These results confirm the stability and reliability of our proposed framework when processing highly diverse tumor shapes, which is critical for precise diagnostic isolation and subsequent therapeutic mapping. Furthermore, to address the historic lack of clarity and transparency in deep vision networks, Grad-CAM was integrated to map the models' internal decision pathways. This inclusion fills a critical research gap by providing visibility into the decision logic that guides automated MRI tumor identification. Finally, a functional Brain Tumor Detection System was deployed via Streamlit, enhancing human-computer interaction and widening access to advanced medical diagnostic tools, demonstrating strong potential for real-world integration.
Maintaining rigorous standards of project reproducibility is essential for preserving scientific integrity. To support this objective, the complete codebase developed for this study has been deposited into a public repository on GitHub, accessible via the following URL: https://github.com/Overrated1987/Empowering-MRI-Based-Brain-Tumor-Classification-with-Deep-Learning-and-Grad-CAM/ (accessed on 2 October 2023). This repository permits investigators to thoroughly inspect the code architecture, review the project directory hierarchy, and verify specific implementation strategies. Furthermore, a comprehensive README file accompanies the repository, outlining the necessary prerequisites and execution steps required to establish the computational environment and replicate the reported experimental findings. To optimize transparency and readability, the entire workflow is presented within interactive Jupyter Notebooks. These documents seamlessly integrate distinct code execution blocks, specific data preprocessing configurations, deep learning model deployments, and their subsequent empirical outputs. By navigating these notebooks, researchers can obtain a nuanced understanding of the methodology and systematically verify the analytical outcomes. Through this open-source distribution and the structured formatting of Jupyter Notebooks, this work aims to foster an environment of transparency, facilitate cross-verification, and promote collaborative reproducibility within the wider scientific community.
While the proposed computer-aided diagnosis (CAD) framework introduces significant technical improvements, several distinct constraints persist that must be resolved to optimize the clinical utility and generalizability of the architecture.
Privacy Concerns and Data Sharing: A primary constraint of the current pipeline is its dependency on centralized MRI diagnostic datasets, which are heavily governed by strict medical data privacy laws. These regulatory barriers substantially restrict the fluid exchange of imaging data across independent clinical institutions, thereby complicating the aggregation of highly diverse and ethnically representative training distributions. Such limitations in data diversity can severely restrict the development of models capable of maintaining high generalization stability across varying patient cohorts and disparate scanner modalities.
Single-Protocol Limitation: The operational scope of this framework is confined strictly to T1-weighted (T1W) MRI sequences, which limits its diagnostic agility when exposed to alternative imaging sequences. Distinct MRI modalities, including T2-weighted (T2W) or Fluid-Attenuated Inversion Recovery (FLAIR) sequences, yield distinct pathological indicators that could provide complementary structural details to optimize classification confidence. Incorporating multi-sequence MRI inputs represents an essential step toward enhancing the overall resilience of the CAD architecture across diverse clinical environments.
To address these current operational boundaries and extend the capabilities of the proposed diagnostic platform, several prospective research directions are detailed below.
Federated Learning (FL): To mitigate the data sharing and privacy challenges tied to clinical brain MRI repositories, subsequent investigations should explore the integration of federated learning frameworks. This decentralized paradigm allows separate healthcare networks to collaboratively optimize a shared deep learning model without exchanging sensitive patient-specific imagery. Instead, local optimization is performed independently at each site, and only the resulting weight updates or model gradients are transmitted centrally, preserving absolute patient confidentiality [48]. Such a strategy would facilitate the training of highly robust and globally generalizable models while strictly adhering to data protection laws.
Blockchain Integration: Merging decentralized blockchain architectures with federated learning pipelines could further maximize the auditability, cryptographical security, and transparency of the optimization process. By creating an immutable, distributed ledger of all gradient transitions and local training cycles, a blockchain layer ensures that every architectural adjustment remains fully traceable and verifiable [49-51]. This security mechanism directly addresses institutional concerns regarding data tampering and model poisoning, fostering the development of trustworthy machine learning practices in medical informatics.
Expansion of Data Sources: A critical objective for subsequent iterations involves diversifying the training infrastructure by aggregating multi-institutional MRI cohorts and integrating a broader spectrum of imaging protocols. This initiative demands the systematic collection and harmonization of imaging data from highly varied clinical environments. Additionally, exploring advanced synthetic data generation methods or sophisticated generative augmentation techniques could expand the training sample space, thereby protecting the network against overfitting and maximizing its generalizable accuracy [52].
Real-World Applicability and Usability: Future validation efforts must prioritize testing the operational performance of the framework within live, routine clinical environments. This includes launching prospective longitudinal trials to monitor diagnostic accuracy across heterogeneous patient populations and fluid clinical scenarios. Furthermore, refining the graphical interface and deeply embedding the software within established Picture Archiving and Communication Systems (PACS) and hospital workflows will be essential to improve user adoption and clinician trust.
Systematically addressing these boundaries through the outlined research pathways will advance the development of computer-aided diagnosis platforms, establishing more precise, resilient, and privacy-preserving solutions for neuro-oncological classification.
Recent innovations in medical imaging analytics, particularly those driven by deep learning paradigms and advanced optimization strategies, have garnered substantial interest due to their exceptional utility in translating complex natural image features into medical domains. Specifically, magnetic resonance imaging (MRI) analysis has increasingly capitalized on deep learning architectures to achieve automated brain tumor detection and multi-class categorization. This study introduces a highly effective computer-aided diagnosis (CAD) framework tailored for multi-class neuro-oncological classification using MRI data. The architecture leverages six distinct pre-trained deep learning networks, integrated alongside rigorous data preprocessing and synthetic augmentation pipelines designed to maximize computational throughput. To resolve the long-standing challenges associated with transparency and the "black-box" nature of deep neural networks, Gradient-weighted Class Activation Mapping (Grad-CAM) was integrated to provide clear spatial visualizations of the model's internal diagnostic reasoning. Furthermore, a highly accessible, interactive Brain Tumor Diagnosis System was constructed via the Streamlit framework, highlighting the practical clinical feasibility of this methodology and offering a functional support tool for radiology teams.
The underlying framework was validated using a publicly available brain MRI dataset sourced from Kaggle, spanning four distinct clinical classifications (Glioma, Meningioma, Pituitary tumor, and No tumor) across a total distribution of 7,023 images. Beyond standard accuracy metrics, the system's performance was rigorously scrutinized using multi-dimensional evaluation criteria—encompassing precision, recall, F1-score, and comprehensive confusion matrices—all of which uniformly verified the diagnostic efficacy of the pipeline. The empirical outcomes demonstrate that the proposed framework delivers exceptional classification accuracy, with the ResNet-50, Xception, and InceptionV3 models consistently converging at performance levels approaching 99%. Ultimately, this computer-aided diagnostic system serves as a powerful, dependable asset for neuro-oncological classification, offering significant advancements in both diagnostic precision and operational utility for modern clinical applications.
The authors would like to express their sincere gratitude to the reviewers for their thorough and insightful comments. Their constructive feedback has been invaluable in refining our research and enhancing the overall quality of this paper. The authors also extend their gratitude to Wenzhou-Kean University for providing the necessary laboratory facilities and execution resources, which were instrumental in completing this work.
None
This research was funded by Wenzhou-Kean University Computer Science and Artificial Intelligence Center (Project No. BM20211203000113), and Wenzhou-Kean University International Collaborative Research Program (Project No. ICRP2023008).
None
Open Access The author(s) retain copyright. This article is licensed under the Creative Commons Attribution-NonCommercial-ShareAlike 4.0 International License. It may be shared and adapted for non-commercial purposes with appropriate attribution, an indication of changes, and distribution of adaptations under the same license. Third-party material may be subject to separate terms identified in its credit line. View the license at https://creativecommons.org/licenses/by-nc-sa/4.0/.
 Transparent Intelligence Publishing