As a leading risk factor for chronic illnesses, obesity highlights the critical need for prompt diagnosis and active management. This research introduces an innovative expert system developed to precisely categorise obesity severity and offer individualised treatment advice. Utilising the SEMMA data mining framework alongside the tidymodels ecosystem, the study assessed five machine learning algorithms: decision tree, random forest, multinomial logistic regression (MLR), Naive Bayes, and support vector machine (SVM). Achieving the highest predictive accuracy (97.48%), MLR was chosen as the definitive model. The platform incorporates an intuitive R Shiny interface, promoting seamless real-time user engagement. Treatment protocols are formulated via if-then rule-based logic to guarantee customised advice for every obesity classification. A comparative evaluation emphasises the system's exceptional diagnostic precision and its functional utility in recommending treatments. By improving accessibility—especially for marginalised rural communities—this system bolsters public health by facilitating preliminary diagnosis, specific interventions, and forward-looking obesity care.
Obesity is intimately connected to a multitude of chronic illnesses and heavily disrupts wider societal frameworks, encompassing family dynamics, workforce participation, and economic stability. Prompt identification and proactive intervention remain essential to mitigating this escalating global health emergency. Nevertheless, existing obesity evaluation strategies, spanning conventional anthropometric measures to artificial intelligence (AI) applications, exhibit prominent shortcomings. Frequently, these approaches inadequately account for the multifaceted nature of obesity's underlying causes. Furthermore, they are constrained by considerable expenses, restricted accessibility, and suboptimal accuracy within certain machine learning (ML) algorithms. Compounding these issues is the frequent disconnect between diagnostic assessment and the provision of therapeutic advice—a deficiency this research seeks to resolve.
The global obesity epidemic has emerged as a paramount public health concern, characterised by a threefold surge in prevalence over the past 40 years [1]. This escalation carries severe consequences for physiological well-being, functioning as a primary catalyst for chronic ailments including cardiovascular disease, diabetes, hypertension, sleep disturbances, and dermatological complications [2, 3]. Moreover, obesity is robustly correlated with psychological distress; its more extreme manifestations notably elevate susceptibility to depressive and anxiety-related disorders [4]. Lifespan is also substantially curtailed by obesity; those with mild obesity face a reduction of roughly 4 years, whereas individuals with severe obesity may forfeit up to 8 years of their expected lifespan [5].
Transcending physical health, obesity alters societal frameworks by dictating economic trajectories, familial relationships, and career prospects. Within the workforce, for example, young Australian women presenting with obesity encounter discrimination at a rate 1.60 times greater than their counterparts without obesity [6], and excess weight additionally diminishes the probability of unemployed individuals successfully returning to work [7]. Furthermore, a robust association between parental body mass index (BMI) and offspring BMI notably amplifies the threat of childhood obesity [8]. From a financial perspective, obesity accounts for a substantial fraction of medical spending; individuals with obesity generate healthcare costs roughly 30% greater than those maintaining a healthy weight [9].
The constraints inherent in contemporary diagnostic protocols—especially the dependence on BMI, which neglects variables like genetic predispositions, age, and behavioural habits—underscore the urgency for more holistic methodologies. Costly imaging procedures, patient discomfort, and a scarcity of highly precise ML models compound these difficulties. Furthermore, prevalent diagnostic models frequently fail to facilitate ongoing or remote evaluations and typically omit therapeutic guidelines. In response to these barriers, this research presents an innovative expert system engineered for precise obesity diagnosis alongside customised treatment planning. Synthesising domain expertise, clinical history, and sophisticated ML algorithms within an accessible web platform, this framework endeavours to elevate medical outcomes via exact classification, individualised guidance, continuous monitoring, and augmented clinical decision support. Furthermore, the platform promotes early intervention, equips users to adopt healthier routines, and guarantees remote connectivity for both patients and clinicians. Ultimately, this all-encompassing strategy holds considerable promise for advancing public health by ensuring timely diagnosis and efficacious obesity management.
Obesity is fundamentally defined by a deleterious surplus of adipose tissue that endangers general health. In adult populations, the condition is typically identified by a BMI > 30 kg/m2 [10]. Although this simple measurement is universally adopted, it possesses inherent flaws, primarily its inability to account for factors such as regional fat distribution and muscle mass. Conversely, for children, the World Health Organisation (WHO) relies on Z-scores to evaluate BMI development, providing a statistically rigorous framework for categorising obesity across distinct age groups [11]. Figure 1 shows the BMI of 5-year-old girls and boys.
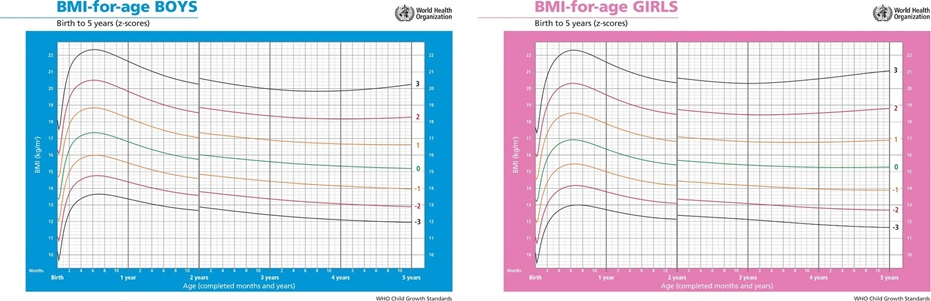
Figure 1. BMI of 5-year-old: girls and boys [10].
While there is a common perception that obesity strictly stems from a positive energy balance, it is actually a highly complex condition shaped by a multitude of variables. These encompass internal, external, physiological, psychological, and critically, genetic factors. The potential reasons for obesity are summarised in Table 1.
Table 1. Potential reasons for obesity.
Factor Category | Classification Details |
Intrinsic Factors | Dietary patterns, lack of physical activity, and lifestyle-related behaviors |
Extrinsic Factors | Socioeconomic conditions and the influence of deceptive advertising |
Hereditary Factors | Genetic predisposition associated with obesity |
Biological Factors | Medication-induced side effects and metabolic processes |
Mental Health Factors | Stress and related psychological influences |
On an internal level, detrimental dietary choices and sedentary lifestyles serve as the principal drivers of excess weight. Additionally, the process of urbanisation has transitioned workforce demands towards less physically demanding labour, thereby aggravating obesity rates [12]. From an external perspective, socioeconomic status is a crucial determinant. Individuals facing economic disadvantages frequently resort to inexpensive, unhealthy foods, resulting in elevated obesity frequencies—especially among women residing in developed countries [13]. Furthermore, technological progress and a significant increase in screen time among children have been correlated with a heightened risk of obesity [14]. Deceptive marketing campaigns promoting high-calorie foods further exacerbate the issue [15]. Genetics also exerts a profound impact, with research indicating that genetic elements can account for 40%–70% of obesity cases [1]. Familial obesity patterns are pronounced, demonstrated by the strong correlation between parental BMI and their children's BMI [8]. Finally, physiological factors—including hormonal imbalances and pharmacological side effects—alongside psychological triggers like stress-induced eating, also contribute to obesity [16].
The management of obesity generally involves lifestyle modifications, pharmacotherapy, or surgical interventions. Effective treatment necessitates personalised approaches that are tailored to individual needs and specific obesity levels [17]. Dietary strategies are central to this effort; high-protein diets can elevate energy expenditure, whereas low-carbohydrate regimes improve satiety and reduce appetite [18]. While curtailing the consumption of sugary drinks is effective, low-fat diets do not yield substantially greater weight loss than high-fat alternatives [19]. Structured eating patterns, including the Mediterranean, DASH, and plant-based diets, paired with practices such as intermittent fasting, are advantageous for weight control [18]. Physical activity is equally vital, with guidelines advocating for at least 250 min of moderate-intensity weekly exercise to achieve significant weight loss [17]. Behavioural strategies, such as self-regulation and monitoring, further optimise long-term weight management [17]. Anti-obesity medications act as a primary option for certain patients whose BMI is > 30 and who struggle to lose weight effectively via dietary modifications and exercise. Furthermore, some patients presenting with a BMI > 40, or a BMI over 35 accompanied by severe complications, who also experience difficulty losing weight through lifestyle changes and anti-obesity drugs, may be considered for weight loss surgery [15].
In obesity diagnosis, supervised machine learning techniques are highly instrumental due to their capacity to leverage labelled data for classification purposes. Expert systems in healthcare, which fuse AI with medical knowledge, significantly propel digital transformation by assisting in diagnosis, structuring treatment plans, and reducing diagnostic errors. These systems are particularly valuable in remote areas, delivering virtual expertise and real-time alerts [20, 21].
This literature review investigates both conventional and artificial intelligence-driven approaches to diagnosing obesity, delineating their respective advantages and limitations to guide the creation of novel diagnostic frameworks. Conventional obesity evaluation techniques are generally classified into three distinct categories: BMI, anthropometric tools, and imaging modalities. BMI serves as a ubiquitous metric that estimates body mass relative to height, stratifying obesity into six distinct risk-based categories [10, 22]. However, the utility of BMI is restricted, notably by its inability to evaluate fat distribution, thereby highlighting the necessity of anthropometric instruments. Metrics such as waist circumference (WC), waist-to-hip ratio (WHR), and waist-to-height ratio (WHtR) yield critical insights concerning regional adiposity and its correlated clinical risks. Specifically, WC quantifies abdominal adiposity, WHR distinguishes between varying anatomical distributions of fat and their respective health implications [23], and WHtR acts as a superior prognostic indicator for both diabetes and cardiovascular ailments [24]. Furthermore, imaging technologies—such as dual-energy X-ray absorptiometry (DEXA), computed tomography (CT), and magnetic resonance imaging (MRI)—supply granular data regarding internal body composition, facilitating the clinical assessment of obesity-linked comorbidities. DEXA quantifies tissue density utilising X-ray technology [25], CT yields cross-sectional visualisations of adipose tissue and internal organs [26], and MRI provides an intricate evaluation of anatomical fat distribution [25]. In spite of their clinical utility, these conventional paradigms exhibit numerous constraints, predominantly their failure to account for physiological heterogeneity, demographic variations, and inherent standardisation difficulties.
Acknowledging these constraints, the scientific community has increasingly pivoted towards AI to transform the landscape of obesity diagnosis. AI has emerged as an indispensable asset for prognosticating diseases within the healthcare sector, exploiting vast clinical datasets to identify trends that bolster diagnostic precision, diminish financial burdens, and optimise operational workflow [27]. Furthermore, AI mitigates human fallibility while delivering sophisticated predictive capacities via ML [21]. To illustrate, Gozukara Bag et al. [28] applied SMOTE-NC to manage class imbalance alongside recursive feature elimination to evaluate algorithms including Extreme Gradient Boosting, Logistic Regression (LR), and Random Forest; notably, LR attained an accuracy of 98.99%. Correspondingly, Solomon et al. [29] engineered a hybrid framework integrating XGB, gradient boosting, and multilayer perceptron classifiers, reaching a 97.16% accuracy rate. Additional investigations, including the work by Rodríguez et al. [30], have similarly validated the efficacy of ML in obesity forecasting across diverse accuracy spectrums. Embedding ML algorithms within expert systems has systematically advanced clinical diagnostics. Albadrasawi et al. [31] developed a Decision Tree-driven expert system for renal disease identification, which elevated diagnostic precision by 15% relative to conventional practices. In a parallel effort, Aguilera-Venegas et al. [32] introduced a hybrid rule-based expert framework to predict type 2 diabetes mellitus, fusing expert-derived rules with a probabilistic decision tree. This approach yielded a mean squared error (MSE) of 0.388%, showcasing enhanced predictive performance compared to singular-method architectures.
Despite the operational simplicity and pervasive implementation of BMI in evaluating obesity, it possesses significant analytical shortcomings. Specifically, it neglects physiological variances, such as those observed in the geriatric population or high-performance athletes, where age-induced shifts in fat distribution or elevated muscle mass can distort outcomes [22]. Moreover, anthropometric parameters like WHR and WC are hindered by a lack of standardised measurement protocols and exhibit diminished efficacy in subjects presenting a BMI over 35 kg/m2 [33]. Additionally, while advanced imaging modalities—namely DEXA, MRI, and CT scans—yield comprehensive body composition metrics, they remain cost-prohibitive and are constrained by factors including radiation exposure and physical equipment limitations [25, 34]. To circumvent these systemic deficiencies, this study proposes an expert system that synthesises critical variables such as genetics, age, and gender. This framework is designed to deliver highly individualised obesity evaluations alongside customised therapeutic strategies, thereby rectifying the pervasive flaws inherent in contemporary diagnostic methodologies.
This segment outlines the structural framework of the proposed expert system and justifies the selection of R and R Shiny for its construction. Figure 2 depicts the overarching architecture engineered to forecast obesity risk and prescribe corresponding therapeutic interventions. End-users submit their personal metrics and lifestyle data (e.g., age, weight, preferred mode of transportation) via a web interface developed using R Shiny. Subsequently, an inference engine processes these inputs utilising ML algorithms to evaluate the risk of obesity, allocating the user to one of six distinct obesity classifications along with their respective probabilistic scores. Following this algorithmic classification, an if-then rule mechanism is deployed to formulate treatment recommendations, which are grounded in authoritative literature and expert clinical consensus. Ultimately, the user interface presents both the diagnosed obesity classification and the correlated treatment protocols.
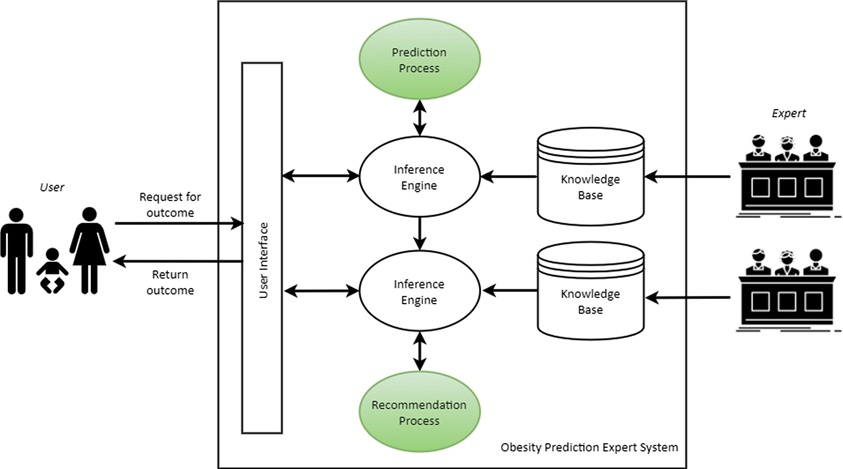
Figure 2. System architecture of the expert system.
The deployment of R and R Shiny for engineering the web interface of the expert system is driven by their robust capabilities in user experience, ML, and data analytics. R's profound aptitude for data visualisation and statistical evaluation makes it highly appropriate for classifying obesity severities, while its comprehensive ecosystem of ML packages, notably tidymodels, optimises the model construction pipeline. Shiny, functioning as an integrated R package, enables the fluid incorporation of interactive web applications with R's ML models. It enhances overall usability by articulating complex outputs—such as therapeutic recommendations and obesity risk levels—in a highly digestible format, thereby serving the needs of both healthcare practitioners and patients. Additionally, Shiny's capacity for real-time data execution provides the immediate feedback essential for the operational success of this expert system. Although local data processing may incur lower computational expenses than Shiny, the framework's adaptability for subsequent integration with external databases renders it highly advantageous.
This section delineates the methodologies and materials implemented in the construction of the expert system. The development of the predictive model was structured around the SEMMA data mining framework, encompassing the phases of sampling, exploration, modification, modelling, and assessment.
Within the realm of data mining, established frameworks like KDD (Knowledge Discovery in Databases), SEMMA (Sample, Explore, Modify, Model, and Assess), and CRISP-DM (Cross-Industry Standard Process for Data Mining) provide structured pathways for distilling actionable insights from voluminous datasets [35]. While KDD is fundamentally oriented toward holistic knowledge discovery, and CRISP-DM prioritises the alignment of data mining initiatives with corporate business goals, both paradigms exhibit deficiencies in healthcare contexts—most notably their inadequate emphasis on model interpretability and ongoing maintenance.
Conversely, SEMMA corresponds seamlessly with the core objectives of this research by prioritising therapeutic efficacy and predictive precision within clinical applications. The systematic phases of the SEMMA methodology comprise:
Sample: Utilising the comprehensive dataset to guarantee robust and exhaustive model training.
Explore: Executing exploratory data analysis (EDA) to interpret data distributions and isolate pivotal characteristics essential for exact forecasting.
Modify: Executing data preprocessing procedures, including data cleansing and normalisation, to optimise model performance.
Model: Partitioning the dataset into discrete training and testing cohorts, subsequently deploying an array of ML algorithms—such as Decision Tree and Random Forest—to determine the optimal predictive frameworks.
Assess: Evaluating the performance of the generated models through metrics like recall, accuracy, and precision, applying iterative enhancements as required.
The inherent iterative characteristic of SEMMA facilitates sustained developmental refinement, rendering it exceptionally appropriate for engineering a resilient expert system dedicated to diagnosing obesity and prescribing treatments.
The dataset utilised for this study was acquired from the UCI ML Repository, an esteemed public database administered by the University of California, Irvine. Supplying a diverse array of datasets across disciplines such as healthcare, biology, computer science, and economics, it serves as a highly dependable resource for ML research. Gathered from populations in Peru, Mexico, and Colombia, this public dataset comprises 2111 records, encompassing 16 attributes associated with dietary habits and physical condition. The target variable is stratified into seven distinct obesity classifications. Furthermore, the dataset was subjected to the SMOTE technique to achieve class equilibrium. Owing to its balanced architecture and comprehensive feature set, this dataset represents an ideal foundation for constructing a highly precise obesity prediction model. A comprehensive breakdown of the dataset's variables is provided in Table 2.
Table 2. Detailed description of the dataset.
Attribute | Explanation | Categories / Values |
Gender | Individual's sex | Male/Female |
Age | Age of the individual | 14–61 years |
Height | Stature of the individual | 1.45–1.98 m |
Weight | Body weight of the individual | 39–173 kg |
Family History | Presence of obesity within the family | Yes/No |
High-Calorie Food Consumption | Intake of foods with high caloric content | Yes/No |
Vegetable Intake | Frequency of vegetable consumption | Never/Sometimes/Always |
Number of Meals | Number of primary meals consumed each day | 1–2 / 3 / > 3 |
Snacking Between Meals | Frequency of eating between regular meals | No/Sometimes/Frequently/Always |
Smoking Status | Whether the individual smokes | Yes/No |
Daily Water Intake | Amount of water consumed per day | < 1 / 1–2 / > 2 L |
Calorie Tracking | Practice of monitoring daily calorie consumption | Yes/No |
Physical Activity Level | Regularity of engaging in physical exercise | None / 1–2 days / 3–4 days / 4–5 days |
Electronic Device Usage | Daily duration spent using electronic devices | 0–2 / 3–5 / > 5 h |
Alcohol Intake | Frequency of alcohol consumption | No/Sometimes/Frequently/Always |
Transportation Method | Primary means of transportation | Bicycle/Motorbike/Automobile/Walking/Public Transport |
Obesity Classification | BMI-based obesity category | Underweight / Normal Weight / Overweight I, II / Obesity I–III |
Data preprocessing represents a fundamental phase in dataset preparation, primarily aimed at data cleansing and standardising formats for subsequent analytical or ML applications. The initial dataset exhibited multiple challenges, such as ambiguous column headers and obscured variable identities. Furthermore, the application of the SMOTE technique introduced synthetic data characterised by numerous floating-point numbers, contrasting with the original dataset's strict reliance on integer and ordinal values. To rectify these complications, a series of preprocessing measures were implemented. Column titles were revised to enhance interpretability, categorical features were numerically encoded, and target classifications were restructured through BMI recalculation and category consolidation. The dataset was verified to be free of missing values, and the data underwent standardisation via rigorous rounding and precision management.
This section primarily details exploratory data analysis (EDA) and statistical evaluations, leveraging the preprocessed and consistent dataset to extract profound insights. The overarching objective is to enable data-driven variable selection to inform future model formulation and refinement.
During the initial exploratory stage of the SEMMA framework, establishing a foundational comprehension of the data via preliminary analysis is imperative. Statistical evaluation offers a pragmatic methodology for achieving this. Consequently, a fundamental investigation of the dataset was executed utilising a six-number descriptive statistical summary, which constitutes a central element of statistical analysis. Within this dataset, solely age, weight, and BMI represent continuous variables appropriate for such statistical scrutiny. Following preprocessing, the remaining variables assume discrete formats such as {1–2}, {1–4}, or {1–5}, rendering continuous statistical interpretation unfeasible. As a result, the statistical assessment is exclusively outlined for these four continuous variables, detailed in Table 3.
Min. denotes the minimum; representing the lowest observation within the dataset.
1st Qu. denotes the first quartile, which is the median of the dataset's lower half.
2nd Qu. denotes the second quartile, otherwise known as the median, representing the dataset's central value.
Mean represents the arithmetic average of all dataset values.
3rd Qu. denotes the third quartile, representing the median of the dataset's upper half.
Max. denotes the maximum; representing the highest observation within the dataset.
Table 3. Three variables of statistical analysis.
Variables | Max. | 3rd Qu. | Mean | 2nd Qu. | 1st Qu. | Min. |
Age | 61.00 | 26.00 | 23.97 | 22.00 | 19.00 | 14.00 |
Height | 1.980 | 1.770 | 1.702 | 1.700 | 1.630 | 1.450 |
Weight | 173.00 | 107.00 | 86.23 | 83.00 | 65.00 | 39.00 |
BMI | 50.80 | 35.80 | 29.58 | 28.70 | 24.30 | 12.80 |
EDA is an indispensable component of model development, designed to extract data insights via statistical techniques and visualisations to uncover trends, patterns, anomalies, and other critical information. This subsection delivers a comprehensive examination of each variable, yielding vital insights for feature selection and elucidating the prospective impact of these variables on the categorisation of obesity.
Figure 3 illustrates a bar chart depicting the frequency distribution across varying obesity categories. Each bar signifies the volume of subjects within a specific classification. The overweight classification exhibits the maximum frequency, a result of aggregating ‘Overweight I’ and ‘Overweight II’ during the data preprocessing stage. This methodology conforms to the WHO's obesity classification criteria applied in this research, which advocates for stratifying obesity into six distinct levels based on BMI.
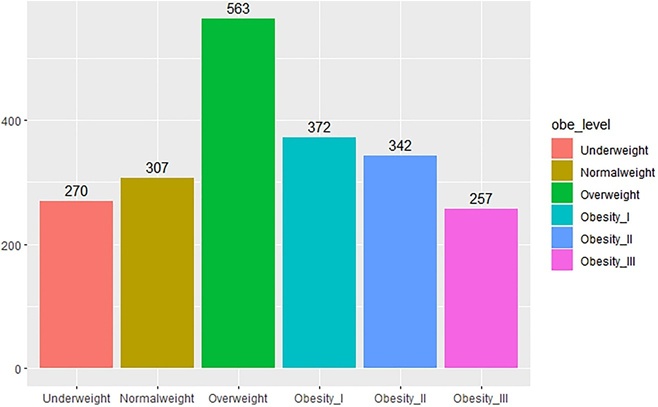
Figure 3. Classification of target variables.
Figure 4 visualises the gender variable distribution, revealing a roughly equivalent proportion of males and females within the dataset. Within the underweight classification, female representation surpasses that of males. In contrast, males substantially outnumber females in the overweight classification. Regarding Obesity Level III, females demonstrate a significantly higher prevalence compared to males. The remaining classifications present only marginal disparities in gender distribution.
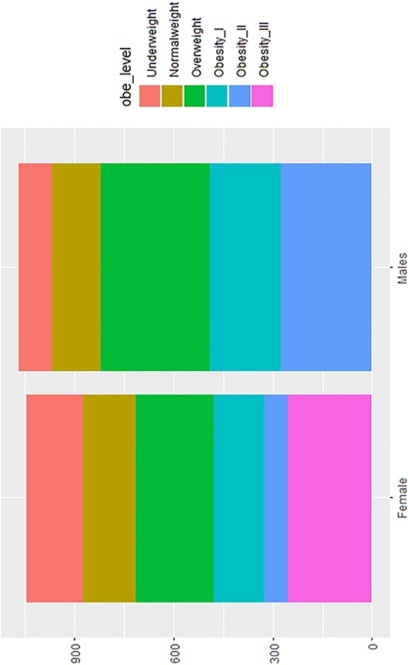
Figure 4. Results of gender data distribution.
Figure 5 delineates the box plot distributions across various weight classifications. The underweight and standard weight cohorts exhibit a more clustered distribution, predominantly concentrated among subjects in their 20s. Conversely, the obese cohort demonstrates a broader distribution spanning ages 20–30, indicating an elevated probability of obesity within this demographic bracket. Across the obesity classifications, Overweight and Obesity Level I encompass the most expansive age range, spanning roughly from 16–42 years.
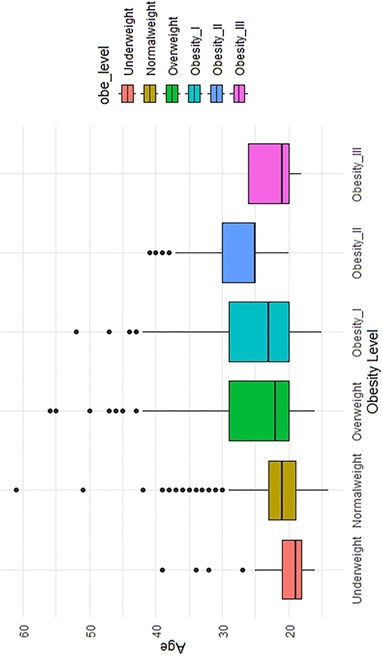
Figure 5. Age distribution across obesity levels.
The scatterplot provided in Figure 6 illustrates the associations among height, weight, and obesity classifications. The solid black line highlights a positive correlation linking height to weight, implying that an increase in height aligns with augmented weight. Consequently, one can deduce that taller subjects generally possess greater body mass.
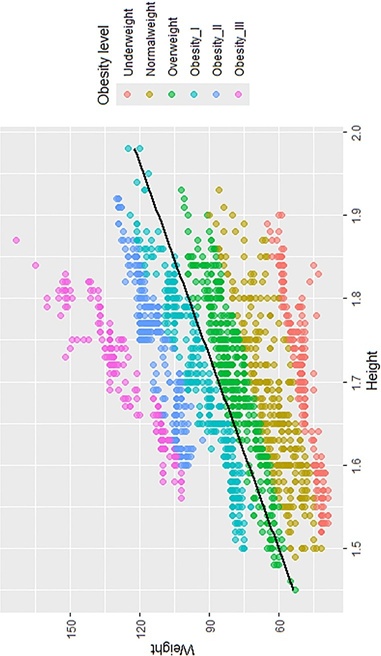
Figure 6. Relationship between height, weight and obesity levels.
Furthermore, the majority of respondents confirmed a family history of obesity, having obese family members, and a tendency to consume high-calorie foods. This indicates that subjects categorised as overweight or obese (levels I–III) frequently possess genetic predispositions toward familial obesity and favour energy-dense diets. In contrast, most participants indicated they do not smoke or meticulously track daily caloric intake, implying that non-smokers who neglect calorie monitoring are more susceptible to obesity. Concerning vegetable intake, the predominant response was ‘sometimes’, although individuals classified under Obesity III overwhelmingly answered ‘always’. Regarding daily hydration, most subjects noted drinking 1–2 L of water, whereas a smaller fraction—particularly within the Obesity II and III cohorts—reported consuming in excess of 2 L. In terms of electronic device usage, the majority of participants engaged with screens for 0–2 h daily, with a minority in the Obesity III group exceeding 3–5 h. Public transportation was the favoured transit mode over walking, motorbiking, or biking for most respondents, with the Obesity III demographic exhibiting a pronounced reliance on public transit. This behavioural preference, alongside other daily habits, strongly correlates with elevated obesity rates. For example, a majority of respondents consumed more than three primary meals daily, pointing toward frequent snacking behaviours; subjects who ‘sometimes’ snacked between meals similarly displayed heightened obesity prevalence. The bulk of participants either engaged in no regular physical activity or exercised a mere 1–2 days weekly, with these cohorts demonstrating higher obesity rates relative to their more physically active counterparts. Regarding alcohol intake, ‘sometimes’ emerged as the most common response, with a minority reporting frequent or constant consumption.
Following the validation of data consistency and cleanliness, the subsequent phase involved constructing an obesity prediction model leveraging the tidymodels framework. Tidymodels streamlines the model-building workflow through a highly structured approach, permitting systematic, iterative testing of various parameters and model architectures. This procedure encompasses:
Model specification: Establishing the model type and parameters. To classify obesity severities, several supervised classification algorithms were selected, specifically multinomial logistic regression (MLR), random forest, decision tree, support vector machine (SVM), and Naive Bayes. MLR yielded the highest predictive accuracy among these options and was consequently designated as the definitive predictive model. MLR proves exceptionally beneficial for deciphering feature interactions, as it calculates the probability of an instance falling into a specific obesity classification relative to a baseline category. The MLR coefficients signify log-odds variations, which can be exponentiated to derive odds ratios. This facilitates robust interpretation, wherein positive coefficients indicate an increased likelihood of a specific obesity classification, and negative coefficients imply a reduced probability. For instance, a positive coefficient corresponding to high-calorie food intake within the Obesity III classification indicates an elevated probability of extreme obesity compared to the reference group. The direction and magnitude of these coefficients assist healthcare practitioners in pinpointing critical obesity risk factors and formulating individualised therapeutic interventions.
Create recipes: Executing data preprocessing prior to model training to guarantee that pertinent variables are processed correctly. Two distinct recipes were formulated:
– All features recipe: Incorporates the comprehensive suite of variables (e.g., age, weight, family history, physical activity).
– Smaller features recipe: Omits less critical variables to evaluate if a streamlined model enhances performance.
Combine models and recipes: Diverse workflows were constructed by merging the predefined recipes and models. Every workflow underwent evaluation via 10-fold cross-validation. The superior workflow was determined based on overall accuracy and ROC AUC (receiver operating characteristic—area under the curve). While accuracy quantifies the precise classification of obesity severities, ROC AUC evaluates the model's capacity to distinguish among distinct categories—an essential metric for multi-class classification tasks.
Train the model: The optimally performing workflow (MLR paired with the smaller features recipe) was deployed to train the ultimate model.
Evaluate model performance: A comprehensive assessment is detailed within the ‘Evaluation of Expert System’ segment.
Table 4 outlines the overarching methodology employed for the development of the expert system.
Table 4. Methodology for development of expert system.
No. | Research Goal | Data Source | Applied Methods and Techniques | Software / Tools |
1 | Develop a machine learning model | UC Irvine Machine Learning Repository | Decision Tree, Multinomial Logistic Regression, Random Forest, Support Vector Machine (SVM), Naive Bayes, and the SEMMA methodology | R programming language, R Shiny, and RStudio Version 2023.09.0 |
2 | Design an expert system and web-based application | Results generated from Phase 1 | Shiny UI and Server, HTML, and CSS | R Shiny environment |
3 | Generate treatment recommendations | Expert knowledge and evidence from authoritative research studies | Shiny UI and Server, If–Then rule-based logic, HTML, and CSS | R Shiny environment |
The creation of the expert system fulfills the final two research objectives, employing the methodologies and tools outlined in Table 4. A primary objective is the synthesis of the optimally trained model with R Shiny to forge a comprehensive expert system. This integration guarantees fluid data transmission between the interface and the model, facilitating the rapid processing of user inputs and the prompt generation of predictive outcomes. Engineered by RStudio, R Shiny is a powerful framework for constructing web applications within the R ecosystem, comprising both a server and a user interface (UI). The UI dictates user interaction and the overall aesthetic of the webpage by establishing its visual components, structure, and layout. Utilizing Shiny Dashboard elements, the UI of the expert system is structured into a main content area, a sidebar, and a header. Furthermore, the interface is enriched with visual assets, such as value boxes that display predictive outputs clearly and images that highlight essential data. The Shiny Dashboard fosters an orderly visual interface, while its responsive architecture guarantees compatibility across multiple devices, such as tablets and smartphones, ensuring accessibility for users operating on restricted bandwidths. By merging health-centric capabilities with a user-focused design, the system endeavors to assist populations in rural regions by supplying tailored, easily accessible health advice. The backend server operations of the Shiny app encompass dynamic responsiveness to user interactions, predictive modeling, and data administration. Employing a pre-trained ML model, the server calculates the user's obesity classification, triggered via an event-driven process upon clicking the prediction button. First, the server aggregates the inputted data and organizes it into a suitable data frame format; the model subsequently processes this to output an obesity classification along with its correlated probability. Following this prediction, the server applies if-then logic to produce customized advice [36-38], encompassing lifestyle, physical activity, and dietary recommendations, thus achieving the study's concluding aims. These suggestions are conveyed in an intuitive manner, leveraging illustrative graphics and text customized for every specific obesity level. Such an interactive framework ensures that users acquire specific, individualized counsel that corresponds with their unique health profiles.
This research constructed the expert system by fusing an ML model with R Shiny. Both the system and the underlying model underwent rigorous assessment to confirm the accuracy and dependability of this integration. Conventional evaluation metrics applied to the ML model encompass the confusion matrix, which derives several indicators from the comparison of actual versus predicted classifications; overall accuracy, representing the ratio of accurately classified instances; precision, denoting the exactness of positive forecasts; recall, signifying the model's proficiency in detecting positive instances; and the F1-Score, which harmonizes recall and precision into a unified metric. Additionally, the receiver operating characteristic (ROC) curve assesses the model's capability to distinguish among varying obesity severities within a multiclass framework. Following the model evaluation, the overarching expert system was scrutinized utilizing essential metrics such as accuracy and sensitivity, both of which are imperative for diagnostic platforms. Furthermore, user satisfaction was gauged via usability testing, interviews, and structured surveys. This extensive appraisal guarantees that the application remains reliable, precise, and intuitive, while fulfilling user expectations and illuminating areas ripe for future enhancement.
This section outlines the primary experimental findings obtained during model construction and elaborates on the results of synthesizing the model within the expert system. Furthermore, it details the evaluative outcomes for both the expert system and the predictive model.
The predictive framework utilizes five distinct ML algorithms alongside two preprocessing recipes to train the models and forecast six distinct obesity classifications. Consequently, a total of 10 workflows were generated and trained. These workflows utilized 70% of the available dataset for training purposes, reserving the remaining data for testing.
The foundational phase of engineering the predictive model required the selection of suitable ML algorithms, bearing in mind that the primary objective—diagnosing varying severities of obesity—constitutes a multiclass classification challenge. As a result, decision tree, random forest, multinomial logistic regression, Naive Bayes, and SVM were selected due to their proven efficacy in managing multiclass scenarios. The model specification procedure is illustrated in Figure 7.
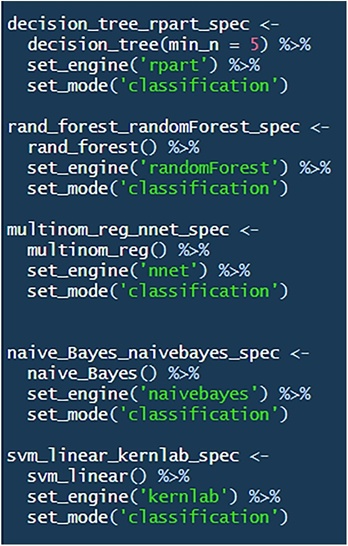
Figure 7. Model specification.
Each selected algorithm contributes unique advantages to the overall model:
Decision Tree provides high interpretability, facilitating a clearer understanding of the variables driving obesity, thereby supporting the objective of engineering an accessible application.
Random Forest demonstrates resilience against overfitting and successfully processes multifaceted healthcare data with superior predictive precision, a requisite for dependable obesity evaluations.
Multinomial logistic regression broadens standard logistic regression to accommodate multiclass problems, permitting the calculation of probabilistic membership for each obesity category and subsequently augmenting the system's interpretability.
Naive Bayes operates efficiently within multiclass frameworks, particularly when processing independent features, rendering it a straightforward and pragmatic option for expert system integration.
SVM is highly adept at navigating intricate decision boundaries, consequently elevating the model's capacity to precisely distinguish among varying obesity severities.
The deployment of these algorithms was executed via the tidymodels framework within R, guaranteeing a systematic and uniform methodology for both evaluation and model training. The selection of these specific models corresponds directly with the overarching goal of constructing a highly accurate and dependable framework for obesity diagnosis.
During model development, recipes in the tidymodels framework serve an essential function by transforming raw input data prior to the training phase. This correlates with the exploratory stage, which prioritizes the isolation of the most impactful variables that drive predictive performance. Two separate recipes were formulated for this investigation:
All features (Recipe 1): This version incorporates an exhaustive array of variables, encompassing gender, age, height, weight, familial obesity history, intake of energy-dense foods, and diverse lifestyle elements like smoking, physical activity, and transportation habits.
Smaller set (Recipe 2): This configuration concentrates on a condensed collection of variables, deliberately excluding elements such as the frequency of vegetable consumption, water intake, screen time duration, and alcohol consumption.
The fundamental objective behind generating these dual recipes was to determine which specific variables optimize predictive accuracy. While Recipe 1 facilitates an exhaustive analysis of the dataset, guaranteeing that no potentially relevant information is neglected, Recipe 2 seeks to streamline the model by removing attributes that exert limited influence on predictive capabilities. Such a strategy permits an equitable comparison, where the comprehensive set functions as the baseline, and the condensed set evaluates if a simpler model can attain comparable or superior accuracy. The outcomes of this comparative analysis demonstrated that streamlining the model via Recipe 2 did not compromise accuracy and, in some instances, even enhanced it, thereby underscoring the efficiency of a more targeted feature selection methodology.
Once the five algorithms and two feature subsets were established, the subsequent phase focused on their integration. Investigating varying model and variable pairings facilitates the identification of the optimal configuration for the dataset and objectives specific to this study. Through empirical trials of these combined models and feature sets, researchers can methodically benchmark various analytical strategies and parameters to ascertain the pairing that delivers superior predictive precision and stability. Consequently, a total of 10 distinct workflows were formulated, detailed in Table 5, with every workflow denoting a specific algorithmic and feature subset pairing.
Table 5. Workflows combined five models and two recipes.
No. | Workflows |
1 | all feasures_dtree |
2 | all_features_multilogit |
3 | all_features_rforest |
4 | all_features_naiveBayes |
5 | all_features_svm |
6 | smaller_set_dtree |
7 | smaller_set_multilogit |
8 | smaller_set_rforest |
9 | smaller_set_naiveBayes |
10 | smaller_set_svm |
Prior to finalizing the most effective workflow, multiple core assumptions and factors warrant attention. Foremost is the necessity for heterogeneity among the selected algorithms and feature groups. The current research incorporates decision tree, random forest, multinomial logistic regression, Naïve Bayes, and SVM methods, paired with two distinct data formulations: an extensive feature array and a condensed version. Even though alternative machine learning techniques exist, this specific quintet was prioritized owing to its validated success in categorization problems. Correspondingly, utilizing two feature groupings was judged adequate—grounded in both exploratory data examination and specialized field expertise—to maintain an equilibrium between exhaustive detail and precision. A subsequent premise necessitates cyclical testing of diverse algorithm-feature pairings, employing accuracy and ROC criteria to gauge the operational success of every setup. The third stipulation mandates transforming nominal independent variables into dummy formats (omitting the dependent variable) and eliminating features exhibiting zero variance to streamline the architecture. Finally, because the dependent variable (BMI) originates mathematically from height and weight, retaining these inputs is critical for accurate forecasting. To secure rigorous algorithmic validation, 10-fold cross-validation partitioned the training dataset. Every single workflow underwent exhaustive testing across all data folds to ensure thorough assessment, and the comparative efficacy of each configuration is ordered in Table 6.
Table 6. Ranking of the workflows.
Workflow ID | Metrics | Mean (%) | Std_err (%) | Model | Rank |
smaller_set_multilogit | accuracy | 97.02 | 0.69 | multinom_reg | 1 |
smaller_set_multilogit | roc_auc | 99.64 | 0.14 | multinom_reg | 1 |
all_features_multilogit | accuracy | 95.32 | 0.50 | multinom_reg | 2 |
all_features_multilogit | roc_auc | 99.62 | 0.10 | multinom_reg | 2 |
smaller_set_svm | accuracy | 94.51 | 0.81 | svm_linear | 3 |
smaller_set_svm | roc_auc | 99.49 | 0.08 | svm_linear | 3 |
smaller_set_rforest | accuracy | 91.67 | 0.90 | rand_forest | 4 |
smaller_set_rforest | roc_auc | 99.38 | 0.08 | rand_forest | 4 |
all_features_svm | accuracy | 93.15 | 0.86 | svm_linear | 5 |
all_features_svm | roc_auc | 99.36 | 0.09 | svm_linear | 5 |
all_features_rforest | accuracy | 91.73 | 0.79 | rand_forest | 6 |
all_features_rforest | roc_auc | 99.35 | 0.09 | rand_forest | 6 |
smaller_set_dtree | accuracy | 87.19 | 1.14 | decision_tree | 7 |
smaller_set_dtree | roc_auc | 96.73 | 0.34 | decision_tree | 7 |
all feasures_dtree | accuracy | 87.39 | 1.10 | decision_tree | 8 |
all feasures_dtree | roc_auc | 96.70 | 0.34 | decision_tree | 8 |
all_features_naiveBayes | accuracy | 57.08 | 1.87 | naive_Bayes | 9 |
all_features_naiveBayes | roc_auc | 92.70 | 0.35 | naive_Bayes | 9 |
smaller_set_naiveBayes | accuracy | 52.81 | 1.37 | naive_Bayes | 10 |
smaller_set_naiveBayes | roc_auc | 92.10 | 0.32 | naive_Bayes | 10 |
The cross-validation assessment metrics for the various algorithms are documented in Table 6, highlighting the mean alongside the standard error for both accuracy and the receiver operating characteristic area under the curve (ROC AUC). An explanation of these metrics is provided using the initial row as a reference. Furthermore, a visual plot is supplied in Figure 8 to clarify these outcomes. The ‘workflow id’ parameter dictates the specific pairing of algorithm and feature subset. For instance, ‘smaller_set_multilogit’ signifies the application of a multinomial logistic regression architecture on a condensed variable grouping (Recipe 2). Accuracy and ROC AUC operate as the primary benchmarking standards. The ‘Mean’ indicator captures the aggregate success rate over the cross-validation iterations, achieving an approximate accuracy of 97.02% and an ROC AUC near 99.64%. The ‘Std_err’ (Standard Error) evaluates the dispersion of these aggregate figures; reduced values denote greater reliability in the estimations. Specifically, the standard errors stand at 0.69% for accuracy and 0.14% for ROC AUC. The designated machine learning technique is listed under the ‘model’ header, noting ‘multinom_reg’ for the multinomial logistic regression. The ‘rank’ attribute conveys the comparative standing of each configuration against its peers, with a score of 1 marking peak efficacy. Attaining the foremost rank in both accuracy and ROC AUC, the multinomial logistic regression coupled with the concise variable set highlights the strategic advantage of isolating fewer, highly relevant predictors to elevate modeling outcomes. This overarching pattern was equally apparent across the Random Forest, SVM, and Decision Tree architectures, although the Decision Tree exhibited marginally suppressed results given its rudimentary nature and vulnerability to overfitting. In contrast, the Naïve Bayes approach yielded the poorest accuracy. Its foundational reliance on the premise of feature independence prevents it from accurately mapping the intricate, interconnected elements driving obesity—a limitation starkly highlighted by the strong direct correlation between height and weight.
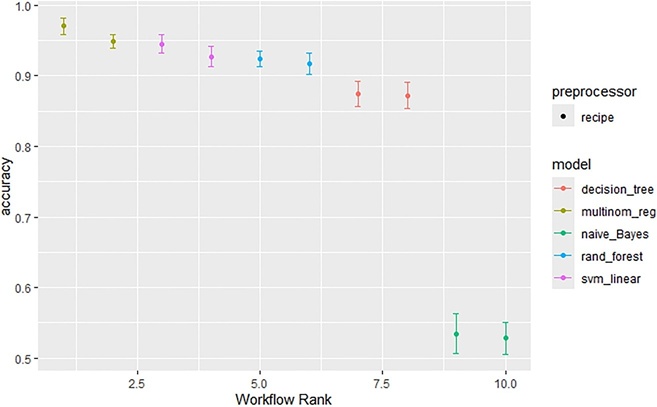
Figure 8. Workflow ranking with accuracy.
The preceding analysis verified that merging the multinomial logistic regression architecture with Recipe 2 delivered superior results. As a result, an idealized workflow synthesizing these elements was adopted specifically for forecasting obesity severity. Embedding these components creates a highly formalized, orderly architecture for the prediction tool, simultaneously boosting system modularity. Once the operational workflow is defined, the algorithm undergoes fitting via the training dataset. As demonstrated in Figure 9, this calibrated algorithm is subsequently ready for deployment to estimate outcomes on entirely novel inputs or to have its predictive validity measured against a testing dataset.

Figure 9. Fit model.
Following the algorithmic fitting process on the training data, the testing subset is deployed to execute validation protocols. Table 7 exhibits the confusion matrix associated with the obesity forecasting tool, serving as the basis for computing accuracy, precision, recall, and F1-scores. Within this matrix, figures shaded in blue denote accurate system forecasts—instances in which the anticipated category perfectly mirrors the actual, observed category. A synthesis of the derived operational metrics is provided in Table 8, whereas the corresponding AUC outputs are graphically rendered in Figure 10.
 (1)
 (2)
 (3)
 (4)
Table 7. Confusion matrix of the model.
Prediction | Underweight | Normal weight | Overweight | Obesity_I | Obesity_II | Obesity_III |
Underweight | 79 | 3 | 0 | 0 | 0 | 0 |
Normal weight | 2 | 90 | 1 | 0 | 0 | 0 |
Overweight | 0 | 0 | 167 | 5 | 0 | 0 |
Obesity_I | 0 | 0 | 1 | 105 | 1 | 0 |
Obesity_II | 0 | 0 | 0 | 2 | 102 | 1 |
Obesity_III | 0 | 0 | 0 | 0 | 0 | 77 |
Table 8. Performance metrics of the model.
Metric | Estimation |
Accuracy | 0.9748428 |
Precision | 0.9758040 |
Recall | 0.9743645 |
f_meas (F1 score) | 0.9749602 |
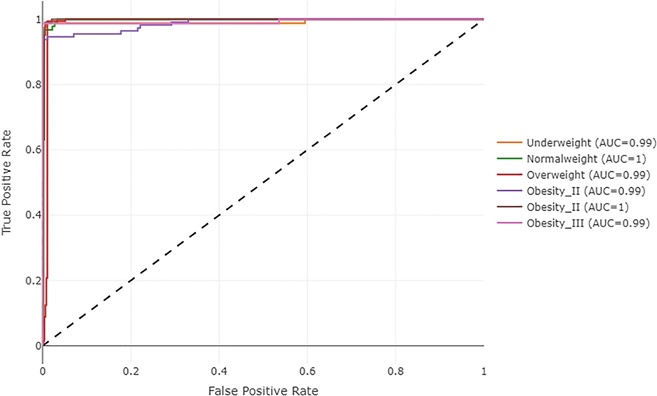
Figure 10. Area under the ROC curve for obesity levels.
Detailed in Table 8, the constructed framework exhibits robust predictive capabilities, registering an accuracy rate of 97.48%. Furthermore, precision, recall, and F1 Score metrics concurrently surpass the 97% mark. Examining the AUC, both the normal weight and Obesity Level II classifications secured a flawless 100%, with all subsequent categories hitting 99%. Altogether, these empirical outcomes validate the expert system’s capacity to correctly classify various states of obesity.
While securing exceptional predictive accuracy represents a primary objective during algorithmic design, it cannot serve as the exclusive benchmark for deployment in medical settings. Model transparency is of equal consequence; healthcare providers require a clear comprehension of the underlying logic driving these forecasts to place trust in the software and confidently integrate it into their diagnostic processes. Consequently, to guarantee functional utility within medical environments, an idealized architecture must carefully navigate the trade-off between accuracy and interpretability. Furthermore, we posit that transparency is intrinsically linked to practical accuracy itself; any model, no matter how transparent its operations, remains wholly inappropriate for clinical diagnostic deployment if it lacks robust predictive power.
Of the assessed architectures, the multinomial logistic regression approach yielded the most favorable outcomes. Its pervasive utilization across healthcare analytics is largely attributed to its fundamental transparency. Contrasting with opaque, black-box frameworks like SVM and random forest, multinomial logistic regression delivers explicit probabilistic justifications for its categorizations. By evaluating six distinct obesity brackets and generating specific probability calculations for every class, this statistical technique substantially amplifies the interpretability of its forecasts. This clarity empowers medical practitioners to deeply comprehend and rely upon the algorithm’s analytical reasoning. Such transparency is crucial when introducing predictive computational tools into active clinical settings, as it secures both dependability and practitioner trust in data-backed healthcare decisions.
The present section details the practical application of the research findings, specifically embedding the ML framework within an R Shiny environment to engineer an innovative expert platform for diagnosing obesity severity. Whereas the preceding segment concentrated heavily on formulating the mathematical forecasting tool—serving as the predictive component of the overall infrastructure—this portion pivots to highlight the subsequent recommendation phase. This shift directly supports the overarching goals of the investigation, guaranteeing a holistic, end-to-end strategy for both identifying and mitigating obesity.
Attachment 1 illustrates the front-end web application interface engineered to facilitate obesity evaluations and dispense treatment guidance. This digital expert platform is segmented into three primary modules: system introduction, obesity assessment, and obesity results. Upon initial access, visitors land on the system introduction page, which relays critical context regarding obesity hazards, the grading scales, the constraints inherent in traditional BMI measurements, and the distinct merits of this newly introduced tool. The architecture guarantees that individuals can gauge their health standing in a highly secure, privacy-preserving manner. Furthermore, comprehensive navigation directions are supplied to ensure a frictionless user experience. Following their review of this material, users can advance to the evaluation module by selecting the ‘Evaluate it now!’ prompt. Throughout the assessment stage, individuals are required to respond to 12 inquiries, which align identically with the condensed feature group (Recipe 2). Following the submission of these answers, the software executes mathematical forecasts via the ‘Click me!’ button to ascertain the individual’s obesity classification. In the subsequent obesity results phase, the interface highlights two primary features: an orange-tinted warning area that broadcasts the anticipated obesity level paired with its specific statistical probability. Because the model computes a probability spread spanning all potential obesity brackets, these figures are arranged in descending order, and the interface exclusively reveals the highest probability classification. A secondary suggestion area issues individualized treatment interventions mapped to that specific forecasted obesity level. To optimize user comprehension and interface simplicity, individuals are restricted to seeing only their most probable classification, ensuring the feedback remains highly relevant and actionable. Conversely, healthcare professionals and system administrators are granted full visibility into the complete probability distribution, permitting a more comprehensive clinical analysis. The platform’s advisory logic operates on a strict conditional ‘if-then’ rule framework, customizing interventions directly to the computed obesity bracket. Because these recommendations are sourced from highly credible domains—spanning peer-reviewed medical literature and clinical expert advice—users are guaranteed to obtain scientifically rigorous and medically relevant instruction. Ultimately, through the amalgamation of transparent predictive modelling and formalized clinical treatment recommendations, the expert software functions as a dependable, interpretable asset for the clinical evaluation and ongoing management of obesity.
The appraisal of the expert system involved measuring its sensitivity and accuracy, which mirrored the predictive algorithm's performance at 97.44% and 97.48%, respectively. These metrics underscore the platform's robust capacity to accurately differentiate among distinct stages of obesity. Furthermore, a comprehensive user satisfaction questionnaire was distributed across a heterogeneous participant pool to gauge multiple dimensions of the platform. This assessment probed elements such as perceived precision, overall user experience, visual layout, and core functionality. Primary investigative focus was directed toward validating the operational integrity of system components, the aesthetic quality and intuitive nature of the dashboard, navigational simplicity, instructional transparency, and the aggregate degree of user confidence and contentment. Subsequent systematic analysis of this feedback will drive iterative platform refinements, guaranteeing that the architecture not only meets user demands but also elevates the standard of subsequent health evaluations.
This concluding segment opens by juxtaposing the empirical outcomes of the current investigation against established benchmarks found in prior literature. Following this comparative evaluation, the manuscript rigorously assesses the structural limitations of the research and proposes strategic directions for subsequent scholarly inquiry. The chapter concludes by distilling the primary discoveries and exploring their broader consequences for the healthcare sector.
Conducting a comparative review against parallel academic works is vital for highlighting the unique capabilities and strategic benefits of this innovative expert framework for diagnosing and managing obesity. At present, a growing volume of scholarly work targets obesity classification through the application of AI-driven systems and ML algorithms. Nevertheless, an extensive review of the literature revealed a scarcity of investigations directly mirroring the specific diagnostic focus of this study. Consequently, the comparative framework was expanded to encompass expert platforms engineered for the diagnosis of alternative medical conditions. Table 9 delivers a synthesized evaluation of the current research juxtaposed with relevant prior investigations, structured around distinct criteria. This evaluation heavily emphasizes the underlying predictive architecture, the statistical accuracy of the models or expert systems, the presence of an active software application, and the integration of therapeutic guidance. The comparative analysis demonstrates that the proposed expert system, utilising multinomial logistic regression, achieves a high diagnostic accuracy of 97.48%, outperforming several existing methods, including decision tree, random forest and hybrid models.
Diverging from preceding literature that concentrates exclusively on statistical precision, the present platform dispenses practical clinical interventions, thereby resolving a critical deficiency in current obesity care methodologies. In a parallel effort, Albadrasawi et al. [31] similarly embedded both an expert interface and therapeutic advice; yet, their utilized decision tree algorithm proved less efficacious than the model proposed herein. Furthermore, while alternative research frequently leverages random forest architectures—yielding accuracy metrics between 72.76% and 98.99%—only the work by Prawira Putra et al. [39] features an integrated expert platform, and notably, none of these alternatives supply actionable diagnostic counsel. Solomon et al. [29] employed a hybrid methodology that reached an accuracy of 97.16%, though it lacked both a user-facing expert interface and treatment suggestions. Conversely, research conducted by Gozukara Bag et al. [28] documented a peak accuracy of 98.99% across the surveyed literature, yet similarly omitted any expert system architecture or diagnostic guidance. In synthesis, whereas numerous investigations attain robust predictive performance via diverse machine learning techniques, the concurrent deployment of interactive expert platforms and clinical advisories is still rare. The expert system proposed in this manuscript stands out as a critical medical asset, prized not solely for its precise diagnostic capabilities, but additionally for its capacity to elevate therapeutic success, especially within marginalized demographic groups. Consequently, this study introduces an inventive, applied methodology capable of augmenting individualized medical treatment and clinical adjudication.
Table 9. Comparative analysis of results.
Article | Top Performing Model | Accuracy / Performance | Expert System or Application Available | Diagnostic Recommendations Provided |
This Work | Multinomial Logistic Regression | 97.48% | Yes | Yes |
Decision Tree | Sensitivity: 92%, Specificity: 95% | Yes | Yes | |
— | MSE: 0.388% | Yes | No | |
Decision Tree | 97.4% | Yes | No | |
Random Forest | 92.25% | Yes | No | |
Random Forest | 98.99% | No | No | |
Hybrid Model | 97.16% | No | No | |
Random Forest | 78% | No | No | |
Random Forest | 72.76% | No | No | |
Random Forest | 96% | No | No |
Despite yielding fresh insights into medical informatics via its benchmarking efforts, this research is subject to specific constraints. The operational success and precision of any expert framework are inextricably linked to the calibre and volume of the underlying data. Owing to limitations inherent in the primary data source, the information utilized for this investigation incorporates a blend of authentic participant records and synthetically engineered data designed to rectify categorical imbalances. To bolster the platform's dependability and guarantee its viability in practical clinical scenarios, subsequent upgrades will prioritize the incorporation of an expansive, dynamic database directly into the architecture. This repository will autonomously archive user inputs in real time, enabling the assimilation of a substantially higher ratio of authentic patient data—specifically continuous longitudinal profiles detailing physiological states and nutritional patterns. Adopting this methodology will facilitate perpetual health tracking and subsequently elevate statistical forecasting precision. Additionally, by systematically logging shifts in users' obesity classifications over extended periods, the platform will be equipped to render visual trend analytics on its dashboard, empowering individuals to seamlessly track their sustained health trajectories. An additional constraint lies in the study’s reliance on BMI as the primary determinant for obesity categorization, a ubiquitous but imperfect metric that fails to account for critical physiological nuances like localized fat dispersion, overall body composition, and muscular density. To rectify this, upcoming iterations of the system will integrate supplementary continuous metrics—namely WC, WHR, and WHtR—to deliver a highly granular evaluation of obesity hazards. Concurrently, an updated protocol for deriving the dependent variables will be engineered, guided by specialized clinical consensus on variable weighting, thereby sharpening the analytical model. Lastly, investigating sophisticated ML architectures, including Gradient Boosting Machines and Neural Networks, will push the boundaries of algorithmic precision and secure the system’s position at the forefront of technological efficacy.
To summarize, this research effectively engineered a novel digital expert platform dedicated to the classification and forecasting of obesity, simultaneously generating customized therapeutic interventions. The rigorous SEMMA data mining methodology directed the methodical transition from unstructured data to an operational forecasting tool, utilizing the R programming language for algorithmic development alongside R Shiny for front-end architecture. Stringent data preprocessing routines guaranteed dataset integrity, while subsequent exploratory data analysis laid a robust groundwork for feature selection. The study deployed a suite of five distinct multi-class ML frameworks: multinomial logistic regression, decision tree, random forest, SVM and Naive Bayes. Of this cohort, the multinomial logistic regression architecture, when fed a condensed feature array, registered a striking predictive accuracy of 97.48%. The resulting R Shiny web application is structurally divided into three primary segments: the introductory overview, the diagnostic assessment, and the analytical results dashboard, collectively ensuring an intuitive, highly interactive user experience. Furthermore, clinical interventions are dynamically produced via a logic framework of if-then rules grounded in specialized medical expertise and mapped precisely to the user's evaluation. Insights garnered from user satisfaction polling drove continuous enhancements to the platform's navigational flow and graphical interface. Subsequent benchmarking verified that this expert architecture exceeds current conventional models regarding both statistical precision and diagnostic trustworthiness, solidifying its status as an elite mechanism for clinical forecasting. The constructed platform constitutes a paradigm shift within medical informatics, particularly concerning the precise diagnosis and subsequent treatment of obesity. By facilitating proactive screening, the technology empowers patients to recognize their specific weight-related vulnerabilities and acquire clinical guidance well before physiological degradation accelerates. Such preemptive measures hold the capacity to invert broader obesity trajectories, supplying a far more economical and potent strategy than combating late-stage morbidities. Because excess adiposity is intrinsically tied to a multitude of chronic pathologies, the broad deployment of this software could profoundly elevate systemic public health administration. Finally, weaving this technology into existing clinical frameworks—especially within resource-deprived rural communities—radically broadens medical access and literacy, thereby equipping populations to navigate their healthcare journeys with confidence and ultimately elevate their comprehensive well-being.
This research was supported by the National Research, Development and Innovation Office (NKFIH) under Grant 2024-1.2.3-HU-RIZONT-2024-00030.
None
None
None
Open Access The author(s) retain copyright. This article is licensed under the Creative Commons Attribution-NonCommercial-ShareAlike 4.0 International License. It may be shared and adapted for non-commercial purposes with appropriate attribution, an indication of changes, and distribution of adaptations under the same license. Third-party material may be subject to separate terms identified in its credit line. View the license at https://creativecommons.org/licenses/by-nc-sa/4.0/.
 Transparent Intelligence Publishing