The escalating complexity of malicious digital activities highlights the necessity for dependable and transparent intrusion detection systems (IDS) to preserve network integrity. Although machine learning frameworks like Decision Tree (DT), Random Forest (RF), k-Nearest Neighbors (K-NN), and XGBoost demonstrate exceptional capabilities in identifying malicious behavior, their inner mechanics grow increasingly opaque as structural complexity and predictive precision expand, creating challenges for high-stakes safety operations. Local Interpretable Model-agnostic Explanations (LIME) is frequently deployed to mitigate this issue; nevertheless, its dependency on Gaussian distributions when generating data variations often fails to capture the non-linear and disproportionate traits of frameworks like CIC-IDS-2018. To overcome these limitations, we introduce an adapted LIME variation strategy utilizing Weibull, Gamma, Beta, and Pareto distributions to more accurately represent the attributes of network telemetry. Our framework enhances the consistency of diverse machine learning systems optimized on CIC-IDS repositories, yielding more constructive and dependable rationales for predictive outputs. These proposed algorithmic adjustments yield a gain in explanatory fidelity of up to 78% relative to the standard normal distribution framework. Variations rooted in the Pareto distribution deliver the most optimal outcomes. Across all evaluated distributions, the Pareto framework consistently generated the peak explanation fidelity and consistency, notably for K-NN (R^2 = 0.9971, S = 0.9907) and DT (R^2 = 0.9267, S = 0.9797). This demonstrates that heavy-tailed distributions align effectively with actual network operational trends, minimizing the discrepancy in attribute significance justifications and rendering them more resilient.
In the contemporary technological environment, cyber risks are turning increasingly advanced and widespread, presenting major hazards to the protection and operational soundness of network frameworks. From unauthorized data exposure to advanced persistent threats, hostile entities persistently exploit system vulnerabilities [1–3], rendering the creation of resilient intrusion detection systems (IDS) vital for recognizing and neutralizing these hazards. Machine learning algorithms such as k-Nearest Neighbor (kNN) [4–6], Decision Tree (DT) [7, 8], Random Forest (RF) [9–11], and XGBoost have displayed noteworthy potential in this field because of their capacity to scrutinize multifaceted network communication configurations and pinpoint malicious operations efficiently [12]. These architectures present diverse advantages, spanning from transparency and structural simplicity in DT and RF to superior efficiency and processing scalability in XGBoost [13, 14]. Nonetheless, despite their utility, the opaque nature of deep neural networks introduces a major obstacle regarding interpretability, particularly within critical sectors like network protection [15].
Local Interpretable Model-agnostic Explanations (LIME) is a frequently utilized approach engineered to clarify the outputs of opaque architectures by constructing locally transparent models [16, 17] around specific predictive instances. LIME produces these justifications by altering input variables and evaluating the subsequent predictions of the underlying architecture. However, LIME’s foundational premise that input variables conform to a normal distribution can produce deficient and deceptive rationales, particularly when implemented on data repositories characterized by non-Gaussian trends [18, 19]. This problem is highly pertinent to network intrusion identification, where data repositories such as CIC-IDS-2017 and CIC-IDS-2018 are frequently asymmetric and manifest non-normal distributional attributes
The CIC-IDS-2017 and CIC-IDS-2018 data frameworks, despite being broadly integrated across the digital security sector, present a major obstacle due to the structural asymmetry in the allocation of network communication categories. A minor segment of the repository consists of hostile activity, whereas the bulk reflects legitimate or standard communications. This disproportion can distort the training phase of machine learning algorithms, biasing them toward the dominant category and culminating in subpar efficacy when isolating underrepresented attack categories. Conventional machine learning methodologies frequently encounter difficulties generalizing successfully under these conditions, experiencing diminished precision when interacting with minority target classes.
Despite these developments, clarity remains an issue. LIME has been broadly implemented to counter the opaque character of machine and deep learning architectures by formulating justifications via input alterations. However, the performance of LIME drops significantly when encountering non-normally distributed variables, an occurrence typical in network communication frameworks like CIC-IDS-2017 and CIC-IDS-2018. LIME operates under the premise that input data is normally distributed, causing it to formulate data variations that fail to mirror the authentic distribution of network communications. When LIME alters data points by initiating minor modifications based on Gaussian assumptions, it can produce improbable data records that deviate substantially from the actual data structure of the repository. This can result in explanations that are either flawed or uninformative, particularly when analyzing intricate network telemetry patterns linked with diverse cyber-attacks.
In this study, we counter the constraints of LIME’s variation formulation technique for non-Gaussian data by introducing an adapted modification strategy. Our methodology is custom-engineered to accommodate the unique attributes of asymmetrical network communication repositories, ensuring that data variations more precisely mirror the authentic distribution of the information. Through this mechanism, we elevate the quality of the justifications formulated for machine learning models optimized on CIC-IDS-2018, delivering more precise and valuable perspectives into the pinpointing of malicious network communications. This revised framework not only elevates clarity but also aids in validating and refining the paths taken by machine learning models, ultimately supporting the creation of more transparent and dependable intrusion detection architectures.
Explainable AI (XAI) techniques, particularly when applied to complex deep learning systems like Transformers, frequently exhibit volatility and imprecision due to the intricate design of these systems [21]. Derivative-based frameworks, though widespread, isolate only local model dynamics, failing to capture global relationships that guide outcomes. Attention frameworks are often incorrectly substituted for genuine explanations, even though their metrics are determined by scaling and softmax computations that misrepresent their actual significance. Layer Normalization (LayerNorm), a ubiquitous element in Transformers, redistributes internal activations, masking the direct impact of input elements on final model predictions. The absence of relevance conservation across architectural layers in numerous XAI frameworks leads to random significance allocation, creating contradictions in interpretations. Furthermore, the vulnerability of specific architectures to minor input modifications magnifies noise, culminating in highly erratic and untrustworthy significance metrics. Non-linear mappings within these architectures add further complexity to attribution, as conventional XAI frameworks frequently fail to account for global contextual dependencies. The intensification of bias is an additional challenge, as XAI strategies may unintendedly emphasize accidental correlations or anomalies, misguiding analysts. These deficiencies render explanations untrustworthy and susceptible to misconstruction, particularly in critical sectors.
Contemporary investigations emphasize broadly applied explanation strategies for AI architectures and their severe variances under minor input modifications in particular scenarios [21]. Studies indicate that conventional local interpretation approaches can generate conflicting deductions, creating doubts regarding consistency. Furthermore, these strategies frequently fail to identify the genuine rationale underlying model choices, thereby introducing a hazard of misconstruction. This limitation is magnified by confounding elements that are difficult to segregate. Additionally, attention systems utilized within XAI are frequently misconstrued as explanations, though their values are governed by scaling and softmax configurations that distort their actual importance. Consequently, confidence in the interpretability of intricate systems is weakened, notably in high-stakes fields. Traditional assessment standards fail to fully capture explanation volatility, thereby providing an incomplete perspective on XAI utility. The requirement for enhanced metrics and strict validation frameworks to confirm that explanations closely reflect fundamental model dynamics is frequently stressed. Moreover, a balanced emphasis on both local and global transparency is advised. Ultimately, lacking strict validation, these interpretation strategies can generate more ambiguity than insight, emphasizing the fundamental requirement for consistency in XAI.
As a prominent post-hoc interpretation framework, LIME remains highly vulnerable to malicious manipulation, as adversaries can exploit its dependency on localized random variations to construct deceptive diagnostic outputs. Empirical data reveals that minimal, mathematically optimized distortions within an input file can trigger sweeping realignments in how LIME attributes feature importance, underscoring a clear deficiency in structural resilience [22]. By carefully crafting synthetic data perturbations that sit outside the bounds of the authentic operational distribution, it becomes possible to manipulate LIME into assigning immense explanatory weight to entirely immaterial parameters. Such strategic exploits highlight the core vulnerabilities of relying on local linear approximations, which fundamentally fail to capture the broader global interactions governing complex target networks. Furthermore, the sampling mechanism within LIME regularly injects artificial instances that do not reflect genuine network behavior, severely undermining the real-world validity of its output diagnostics. This representational gap can easily prompt engineering teams to draw false conclusions regarding the exact variables orchestrating a model's classifications.
An additional point of concern centers on LIME’s absolute dependence on kernel-centric weighting functions, a design choice that renders its final outputs exceptionally volatile under minor configuration adjustments. Trivial updates to sampling protocols, neighborhood boundaries, or kernel dimensions can generate deeply divergent interpretative profiles, revealing an underlying issue with functional instability. Consequently, these operational flaws pose a severe obstacle to the method’s credibility, rendering it ill-suited for target domains where interpretability dictates critical security decisions.
Because these intrinsic vulnerabilities are widely recognized within explainable AI circles, contemporary researchers are actively creating an array of distinct validation metrics to systematically audit the performance of XAI tools [21]. Among these, fidelity is prioritized as a primary benchmark, evaluating how closely an external interpretation mirrors the authentic underlying logic used by an algorithm during inference. Completeness represents another core measurement, verifying whether every single influential feature guiding a predictive decision has been successfully accounted for within the generated explanation.
Stability enforces the principle that marginal variations in input characteristics should never result in wildly erratic or inconsistent interpretive outputs. Monotonicity demands that an accumulation of corroborating evidence for a distinct target class must correspond with a proportionally heightened emphasis within the final diagnostic report. Continuity stipulates that generated interpretations must transition smoothly and incrementally whenever the primary input features experience gradual shifts.
Faithfulness is deployed to confirm that a given explanation framework offers a transparent, uncorrupted window into the model’s internal operations. Comprehensibility targets the cognitive ease with which human security personnel can review and absorb the provided rationale. Utility evaluates whether a given interpretation provides actionable support to operators trying to achieve specific functional goals. Trust quantifies the actual degree of reliance users maintain toward a model's choices after analyzing the provided documentation. Finally, plausibility measures how naturally and logically an explanation matches established domain expertise or intuitive common-sense rules.
At the same time, core tenets of formal scientific reasoning are being progressively embedded within explainable AI architectures to strengthen both transparency and operational reliability [23]. Computational frameworks are currently being structured around domain-specific axioms and pre-established hypotheses to guarantee that derived interpretations remain logically consistent and auditable. To validate these outputs, emerging evaluation metrics are explicitly tailored to score logical integrity, human interpretability, and situational applicability. While some computer scientists leverage qualitative user studies to collect sophisticated human feedback, others implement rigorous quantitative strategies to measure exact structural fidelity.
Furthermore, novel architectural paradigms are arriving to narrow the distance between abstract theoretical models and actual production environments via the iterative optimization of model hyperparameters. Multi-disciplinary initiatives are increasingly commonplace, allowing experts from diverse scientific domains to assist in formalizing strict evaluation benchmarks and designing comprehensive interpretive frameworks. Multiple experimental setups are currently undergoing active testing to automate the production of explanations that inherently mirror structured scientific logic and maintain full mathematical alignment with the baseline data.
Engineers are also paying close attention to ethical alignment, particularly when an automated decision carries profound broader societal consequences. Parallel to these efforts, modern research paths are focused on feeding active user critiques directly back into XAI engineering loops, allowing designers to calibrate explanatory outputs to match the precise requirements of individual technical stakeholders. Ultimately, these unified initiatives aim to solidify rigorous, scientifically validated methodologies that yield far more credible and easily auditable interpretations.
The strategic injection of data perturbations remains a foundation technique throughout XAI research, offering clear visibility into the ways minor variations in input data reshape overall algorithmic behavior. Modern literature demonstrates that the systematic engineering of input variations can effectively expose hidden vulnerabilities and latent operational biases, allowing engineers to refine core model architectures for superior real-world performance [24]. Variations engineered within local interpretability frameworks have proven highly effective at isolating critical classification boundaries and complex multi-dimensional feature dependencies [25]. By tracking the outcomes of intentional input alterations, researchers can reliably isolate the exact variables driving an explanation, thereby boosting both operational transparency and human confidence in deep network architectures [26].
Approaches based on the injection of structured noise or domain-specific data variations offer an additional layer of utility by exposing highly unstable sectors along a model’s decision boundary [27]. These validation strategies emphasize the tight relationship between localized feature importance and macro-level model fidelity, giving technical teams the evidence required to confirm that predictions are anchored in valid data. Moreover, testing carried out with generative data-variation tools can uncover obscured interactions between disparate variables, streamlining the application of precise architectural adjustments.
Scholars are also actively investigating hybrid methodologies that merge localized variations with overarching global diagnostics, ensuring that generated explanations remain structurally sound across both macro and micro contexts. This capacity to customize data-variation techniques to accommodate different data types guarantees high flexibility across distinct production domains, ranging from computer vision tasks to advanced natural language processing. In the final analysis, these perturbation-driven strategies act as a potent diagnostic suite through which complex machine learning frameworks can be audited, repaired, and improved, paving a direct path toward more dependable and transparent artificial intelligence frameworks.
The architectural stability of an explanation operates as a decisive metric when auditing overall robustness and operational reliability, a reality that is particularly true inside the domain of network intrusion detection. Multiple independent investigations have evaluated this dynamic, closely analyzing how perturbation-driven frameworks or surrogate modeling approaches hold up when tasked with processing non-linear and highly asymmetrical datasets like CIC-IDS-2017 and CIC-IDS-2018.
Table 1 offers a comprehensive structural summary and comparison of these historical approaches, highlighting reported stability indices. Recent studies have meticulously tracked the structural consistency of explainable AI tools like LIME when paired with machine learning models deployed for network security. Stability is commonly audited via indices like Jaccard similarity or parallel feature-alignment benchmarks collected across iterative explanation runs. The historical works indexed in Table 1 seek to resolve the persistent problem of low explanation stability caused by skewed class distributions, intricate decision surfaces, and synthetic variations that fail to mirror real-world parameters.
Table 1. Modified LIME stability results.
Study / Reference | Jaccard Similarity (S) | Classification Model | Number of Classes |
Zhengze Zhou et al. [28] | 0.85 | Logistic Regression (LR), Random Forest (RF) | 2 |
Revoti Prasad Bora et al. [29] | 0.90 | Inception v3 | 37 |
Ding et al. [13] | 0.97 | k-Nearest Neighbors (kNN) | 2 |
Meng et al. [30] | 0.97 | Transformer | 4–26 |
0.95 | Long Short-Term Memory (LSTM) | ||
Saadatfar et al. [31] | 0.97 | Support Vector Machine (SVM) | 2 |
0.94 | Gradient Boosting | ||
0.97 | Random Forest (RF) |
The CIC-IDS2017 and CSE-CIC-IDS-2018 datasets remain standard benchmarks within modern Intrusion Detection System (IDS) research due to the deep, multi-faceted network telemetry profiles they provide. The CIC-IDS2017 repository was compiled by capturing five continuous days of authentic network communications spanning from 3 July to 7 July 2017; every unique data row contains 79 distinct attributes, including an explicit class designation mapping the traffic to one of 15 separate operational categories. This repository captures a diverse collection of malicious methodologies, including denial-of-service and brute-force campaigns, rendering it exceptionally useful for training automated security tools.
The CSE-CIC-IDS-2018 framework serves as an expanded iteration of the CIC-IDS-2017 dataset, radically expanding total data scale to encompass more than 16 million network flows, a major increase over the original repository's 2.8 million entries [32]. It retains every single attack profile introduced in the baseline collection while integrating contemporary application-layer hazards such as SQL injection, cross-site scripting (XSS), and command injection exploits [33]. These modern inclusions track authentic contemporary cyber-attack trends, where public-facing web portals serve as primary attack targets.
Nevertheless, the newer CSE-CIC-IDS-2018 repository continues to struggle with severe class asymmetry, as a single dominant traffic category claims 82.66% of all recorded data points. To counteract this limitation, engineers often merge the two repositories to artificially increase the density of rare traffic categories, thereby improving the downstream training of machine learning architectures [34]. Furthermore, executing preprocessing filters to purge exceptionally rare or erratic data points can assist in engineering a more balanced [35] and noise-free dataset, ultimately optimizing IDS operational accuracy. Together, these data repositories yield a highly reliable foundation for advancing network defense engineering, allowing for the construction of models that parse a broad spectrum of both legacy and modern exploit mechanics. Following final processing, our experimental dataset contained 28 unique classes. Post-feature optimization, 32 distinct features were preserved for analysis, categorized into 7 frequency-skewed categorical binary variables and 25 continuous numerical variables.
LIME operates by approximating the decision space of a complex target architecture locally around a specific inference instance using an easily interpretable surrogate framework, which is almost always a basic linear model. However, this mathematical approach is entirely dependent on the assumption that the target model's internal behavior remains roughly linear within the immediate spatial neighborhood of the record undergoing explanation. When dealing with the intrinsically non-linear properties of the CIC-IDS datasets, this baseline assumption breaks down completely due to the following structural realities:
Non-linear decision boundaries [36]: The authentic classification boundaries produced by models optimized on these network repositories are highly non-linear. Consequently, a linear surrogate framework cannot faithfully map these intricate divisions, even within a restricted localized region, generating fundamentally misleading interpretations.
Deficient local approximation [37]: The presence of highly non-linear feature interactions ensures that marginal shifts in input variables can trigger massive deviations in final classification outputs. LIME’s linear approximations are mathematically incapable of mapping these localized sensitivities, producing diagnostics that fail to mirror the authentic operational patterns of the primary model.
Synthetic data generation issues [38]: LIME generates artificial data points directly within the spatial neighborhood of the target instance to optimize its localized surrogate model. Within high-dimensional, non-linear feature spaces, this synthetic data regularly fails to reflect the actual geometry of the baseline data distribution, causing the surrogate mechanism to provide a deeply flawed representation of localized model behavior.
A primary operational constraint of the standard LIME algorithm is its dogmatic reliance on the assumption that data elements conform strictly to a normal distribution during the perturbation generation phase. In practice, LIME functions by generating random variations around input features and subsequently training a locally interpretable surrogate framework (typically a linear model) around the target prediction to explain the decision path of an underlying black-box architecture. However, this assumption of Gaussian data behavior introduces severe operational errors when processing complex real-world network data repositories like CIC-IDS-2017 and CIC-IDS-2018, which exhibit highly non-Gaussian distributions due to the structural class imbalances and multifaceted nature of modern network telemetry [39].
Whenever LIME alters feature values based on classical normal distribution rules, the resulting synthetic data rows frequently plot completely outside the authentic boundaries and geometric structure of the original data space. For example, essential network telemetry metrics such as packet size, protocol classifications, and connection duration routinely follow non-normal, heavily skewed distributional curves. As a direct consequence, LIME’s standard perturbation routine can easily inject entirely unrealistic or scientifically irrelevant data records that bear zero relationship to actual network behaviors. This introduces severe mathematical distortion into the locally interpretable surrogate framework, ultimately delivering explanations that are heavily compromised or deceptive.
The generation of a LIME interpretation initiates by sampling an array of novel data points directly within the localized spatial neighborhood of the record being analyzed, effectively assembling a specialized local dataset. This newly engineered sample matrix is then fed directly into the primary black-box architecture to capture corresponding classification outputs. Every generated data point is subsequently assigned an explicit proximity weight reflecting its exact distance from the original record.
Using this collection of weighted samples alongside their corresponding model outputs, LIME trains an interpretable surrogate algorithm—specifically a ridge regression model—that mathematically captures the localized dynamics of the overarching complex system. By analyzing the derived coefficients of this interpretable surrogate model, engineers can directly isolate the specific features wielding the greatest influence over the target prediction. Because LIME is entirely model-agnostic, it can be deployed alongside any complex machine learning architecture or learning algorithm without requiring internal modifications. This operational flexibility allows practitioners to extract valuable structural insights from the inner workings of otherwise opaque algorithmic systems.
This section details the explicit algorithmic enhancements introduced to the LIME framework to overcome the persistent challenges encountered when analyzing highly non-linear datasets and models. These strategic adjustments prioritize the integration of dataset-specific geometric attributes, specifically replacing the traditional Gaussian distribution sampling framework with a specialized random sampling routine utilizing Beta [40], Gamma [41], Pareto [42], and Weibull [43, 44] distributions, with the ultimate objective of optimizing both the mathematical robustness and real-world relevance of the resulting explanations.
To analyze the consistency of the generated justifications for a specific target class L, the following structural process is executed:
For target class L, we produce n separate interpretations by executing the explainer framework n consecutive times. Every separate operation i yields an ordered list Ei containing the highest k attributes, where Ei represents the set of the top k parameters extracted during the i-th separate trial, and n denotes the cumulative iterations performed for the consistency audit.
Pairwise Jaccard similarity calculation. For every unique combination of attribute arrays ( Ei, Ej) where i < j, we determine the Jaccard similarity J Ei, Ej, formalised as follows:
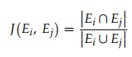 (1)
where represents the total count of attributes shared between both diagnostic outputs and represents the cumulative count of unique attributes distributed across the pair. This similarity index numerically scales the convergence between feature arrays, monitoring the continuity of feature prioritization across paired interpretations.
Mean similarity calculation for stability S. We formalize the consistency metric S as the arithmetic mean of all pairwise Jaccard calculations:
which displays the collective continuity of attribute selection across iterative runs as follows:
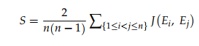 (2)
where S represents the stability value for class L, distributed along a scale from 0 (signifying a total absence of stability) to 1 (signifying absolute consistency across all trials), and serves as the scaling factor guaranteeing that the average is extracted across all unique pairs of generated explanations.
To maintain descriptive accuracy while simultaneously optimizing consistency, we monitor the fidelity of localized interpretations to evaluate how precisely the linear surrogate architecture maps the performance of the primary black-box model under evaluation. Even when the primary analytical task centers on discrete classification, LIME optimizes a localized linear architecture (specifically a ridge regression model) to approximate the class probabilities output by the target network, managing these metrics as continuous attributes. Consequently, the coefficient of determination (R2 score) is implemented as our primary metric of fidelity via the following expression:
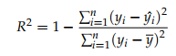 (3)
where:
R2 — fidelity score for class;
n — number of data points (perturbed sample count);
yi — original model’s prediction for data point i (class probability);
ŷi — surrogate model’s prediction for data point i (fitted regression for class probability output);
— mean of the original model’s predictions for the class.
Following a comprehensive audit of the baseline data, it became apparent that numerous variables exhibit severe outlier anomalies. Consequently, it was crucial to filter out 5% of the most extreme terminal values to raise the foundational quality and dependability of our empirical evaluation. Upon interacting with this processed data matrix, it was discovered that the underlying distributions are highly zero-inflated. The non-zero values recorded for continuous numerical attributes routinely display a pronounced right-skewed pattern (resembling a Pareto distribution), pointing toward a underlying log-normal, exponential, or alternative heavy-tailed probability distribution (Figure 1).
For instance, telemetry attributes such as “ActiveMax” and “ActiveMin” conform to zero-inflated allocations where the baseline value of 0.0 is overwhelmingly dominant; nevertheless, once these zero records are isolated, the remaining data profile matches a highly skewed curve, potentially logarithmic or exponential in nature (Figures 1a and 1b). Similarly, the distribution for “BwD IAT Mean” is radically right-skewed, exhibiting an intense aggregation at 0.0 with sparse observations scattered across the upper numeric ranges (Figure 1c). This structural distribution aligns cleanly with a zero-inflated exponential or power-law configuration.
Conversely, lower-cardinality discrete integer variables, including “Destination Port”, display an allocation anchored around a few highly dominant values, yielding a categorical-style distribution marked by sharp spikes at precise numerical thresholds (Figure 1d). Dispersed, low-frequency observations are also visible across rarely deployed port destinations, demonstrating that specific operational modes dictate the distribution's shape. Regarding the behavior of “Bwd Packets/s”, following the exclusion of the top 5% extreme outliers, the variable presents a zero-inflated profile, indicating that a substantial volume of data flows contains no backward packets per second. The remaining non-zero measurements follow a symmetrical, bell-shaped distribution that peaks near 10,000, closely mimicking a traditional Gaussian curve (Figure 1e).
Lastly, the “Packet Length Variance” attribute displays a bell-shaped, marginally right-skewed pattern across its non-zero data segments. This non-zero domain resembles a normal-like structure, with the bulk of observations clustered around 110,000 paired with an extended tail pushing toward the higher variance limits (Figure 1f). These final two metrics represent the only attributes within the entire repository that exhibit structures mirroring a classic Gaussian distribution.
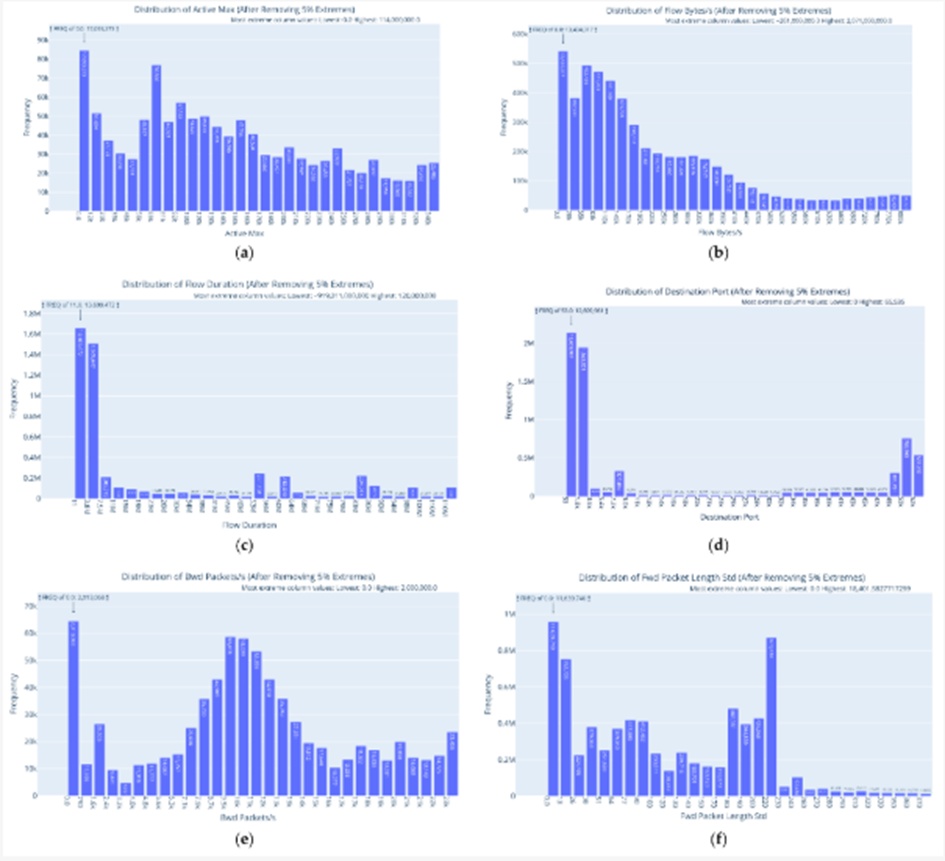
Figure 1. Examples of distribution of selected attributes: (a) Active Max, (b) Flow Bytes(s), (c) BwD IAT Mean, (d) Destination Port, (e) Bwd Packets/s, (f) Packet Length Variance.
True normally distributed data is completely absent from this repository. Consequently, to replicate these distinct operational shapes within the synthetic variations utilized by LIME, we implement parametric probability models including Gamma, Beta, Pareto, and Weibull distributions. These alternative mathematical models are structurally optimized to capture heavy-tailed phenomena.
We systematically integrated heavy-tailed (Pareto), bounded (Beta), skewed (Weibull/Gamma), and balanced (Gaussian) distribution curves to thoroughly evaluate alternative data-perturbation methods inside the LIME architecture. By incrementally adjusting key shape parameters (e.g., scaling Pareto’s \alpha across a range from 3 to 7, and shifting Weibull’s k from 0.8 to 1), we successfully isolate progressive variations in tail weight and skewness while maintaining a uniform scale metric (c = 1). These strategic selections illustrate exactly how LIME’s localized explanations respond to domain-specific noise structures, checking structural resilience across extreme boundary conditions.
The attribute profiles within this telemetry repository demonstrate a dense aggregation near zero, defined by asymmetrical tails stretching away from the origin with a negligible probability of return. To replicate these distinct operational shapes within the synthetic variations utilized by LIME, we implement parametric probability models including Gamma, Beta, Pareto, and Weibull distributions. These alternative mathematical models are structurally optimized to capture heavy-tailed phenomena.
Gamma PDF (probability density function):
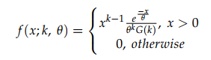 (4)
where k > 0 is the shape parameter and θ > 0 is the scale parameter of the gamma distribution.
BetaPDF:
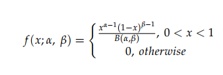 (5)
whereα>0,β>0areshapeparameters.
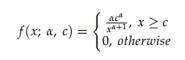 (6)
Pareto PDF:
where α > 0 is the shape parameter and c > 0 is the scale parameter.
WeibullPDF:
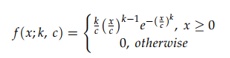 (7)
where k > 0 is the shape parameter and c > 0 is the scale parameter.
The explicit operational variables evaluated throughout this study are organized within Table 2. The constants maintained across all laboratory environments include the selection of a ridge regression algorithm as LIME's internal surrogate framework, the production of 5000 synthetic variations for every discrete explanation, the tracking of the top 10 targeted features for metric assessment, and the execution of 30 independent explanation runs for each distinct structural configuration.
Table 2. Experiment variables.
Distribution-Based Sampling Approaches | Predictive Models Evaluated | Test Samples Selected for Explanations |
The dataset was perturbed using the following probability distributions and parameter settings: • Gaussian distribution (reference baseline); • Beta distribution with parameters: 𝛼 = 0.5, 𝛽 = 0.5; • Gamma distribution with parameters: k = 1, θ = 1; • Pareto distribution with shape parameter (α) values of 3, 4, 5, 6, and 7, and scale parameter (c) = 1; • Weibull distribution with shape parameter (k) values of 0.1, 0.4, 0.5, 0.7, and 0.8, with c = 1. | Five classification algorithms representing different levels of model complexity were considered: • Decision Tree (DT); • Random Forest (RF); • k-Nearest Neighbor (kNN); • XGBoost (XGB); • CatBoost (CATB). | Explanatory analyses were produced using one randomly selected test sample from each of the following categories: • Label 0 — the most frequently occurring class; • Label 20 — the second most frequent class; • Label 17 — the least frequent class. |
For every distinct convergence of test instance (3 unique labels), target classification architecture (4 separate types), and specific distribution sampling framework and parameter configurations (13 structural permutations), explanations were systematically generated and reviewed across 30 separate operations. Subsequently, each collective set of diagnostic explanations was quantitatively scored by determining both its fidelity (R^2) and stability (S) benchmarks.
The classification capabilities of the three primary frameworks—Decision Tree (DT), Random Forest (RF), and K-Nearest Neighbor (K-NN)—were systemically analyzed via confusion matrices to isolate specific competencies and failures when detecting distinct threat variants (Figure 2). The empirical data indicates that DT records the lowest performance baseline due to its structural simplicity, encountering severe difficulties when mapping intricate decision boundaries, processing highly overlapping feature regions (e.g., Web attacks and diverse DDoS mutations), and identifying exceptionally rare threat categories such as “Heartbleed”.
Conversely, RF consistently surpasses the DT framework, demonstrating enhanced generalization capabilities due to its multi-model ensemble mechanics; nevertheless, it still encounters performance friction when confronted with severe class imbalances and scarce attack profiles. Finally, the K-NN model demonstrates high efficiency when classifying well-segregated data clusters, yet it exhibits elevated rates of misclassification when navigating overlapping or heavily asymmetrical target classes (e.g., variant patterns of “DoS” and “Brute Force”).
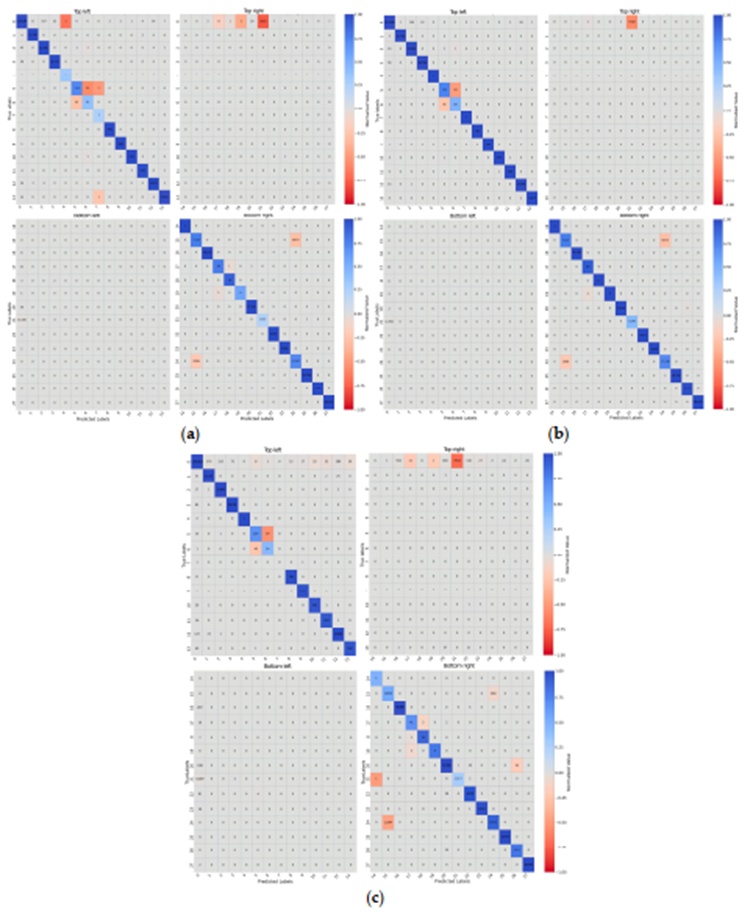
Figure 2. Confusion matrix quadrants for the DT (a), RF (b), and K-NN (c) models with label mapping: {“BENIGN” (0), “DDoS” (1), “PortScan” (2), “Bot” (3), “Infiltration” (4), “Web Attack Brute Force” (5), “Web Attack XSS” (6), “Web Attack SQL Injection” (7), “FTP-Patator” (8), “SSH-Patator” (9), “DoS Slowloris” (10), “DoS Slowhttptest” (11), “DoS Hulk” (12), “DoS GoldenEye” (13), “Heartbleed” (14), “DoS Attacks-SlowHTTPTest” (15), “DoS Attacks-Hulk” (16), “Brute Force-Web” (17), “Brute Force-XSS” (18), “SQL Injection” (19), “DDoS Attacks-LOIC-HTTP” (20), “Infilteration” (21), “DoS Attacks-GoldenEye” (22), “DoS Attacks-Slowloris” (23), “FTP-BruteForce” (24), “SSH-Bruteforce” (25), “DDoS Attack-LOIC-UDP” (26), “DDoS Attack-HOIC” (27)}.
Normal baseline activity—the “BENIGN” class—presents the lowest classification difficulty across all evaluated architectures, a result of its unique signature patterns and its massive statistical dominance within the data repositories. Even so, minor classification errors occur, with occasional instances where standard traffic is misrouted into adversarial categories such as “Bot” (3), “DDoS” (1), and “Infilteration” (21).
Simultaneously, all three frameworks exhibit pronounced diagnostic overlap when parsing application-layer vulnerabilities, most notably between “Web Attack Brute Force” (5) and “Web Attack XSS” (6). Parallel tracking reveals that “DoS Slowloris” (10), “DoS Slowhttptest” (11), “DoS Attacks-SlowHTTPTest” (15), and “DoS Attacks-Hulk” (16) undergo heavy cross-classification across all classifiers, an issue that is particularly visible within the K-NN matrix. These specific diagnostic errors stem directly from converging communication behaviors and matching exploit strategies. Conversely, highly sparse threat signatures, such as “Infiltration” (4) and “Heartbleed” (14), are regularly absorbed by major traffic labels—a vulnerability especially apparent in the DT framework—due to the deficit of corresponding training instances.
The quantitative profiles generated during the optimization phase are organized within Table 3, showing high performance across every monitored parameter. To ensure the reproducibility and structural resilience of these classifiers, a 5-fold cross-validation protocol was systematically executed across all architectures. The XGBoost (XGB) model, configured using the hyperparameters n_estimators = 200, max_depth = 6, and learning_rate = 0.1, yielded the top weighted accuracy of 0.9995 alongside highly resilient macro-level descriptors (precision = 0.93256, recall = 0.844). The RF architecture, utilizing n_estimators = 100 and max_depth = 30, achieved a nearby performance threshold with a weighted accuracy of 0.99875. While the DT framework (max_depth = 30) and the k-Nearest Neighbor engine (kNN) (n_neighbors = 3) delivered strong diagnostic accuracy, they recorded minor performance drops across macro-level statistical evaluations. Lastly, the peak optimization profile for CatBoost (CATB) was mapped by establishing a depth = 8, a learning_rate = 0.1, the standard default L2 regularization coefficient of 3, paired with a Bernoulli data sampling technique and a subsample constraint of 0.8.
Table 3. Classification model training results.
Model | F1 (Macro) | Recall (Macro) | Precision (Macro) | Accuracy (Macro) | F1 (Weighted) | Recall (Weighted) | Precision (Weighted) | Accuracy (Weighted) |
RF | 0.86095 | 0.83321 | 0.92933 | 0.98640 | 0.98311 | 0.98640 | 0.98262 | 0.99875 |
DT | 0.82956 | 0.82715 | 0.84236 | 0.98505 | 0.98222 | 0.98505 | 0.98072 | 0.99724 |
KNN | 0.79188 | 0.79363 | 0.82684 | 0.98217 | 0.97949 | 0.98217 | 0.98021 | 0.99583 |
XGB | 0.86501 | 0.84400 | 0.93256 | 0.98668 | 0.98264 | 0.9866 | 0.98343 | 0.99954 |
CATB | 0.81522 | 0.80090 | 0.87745 | 0.98653 | 0.98245 | 0.98653 | 0.98322 | 0.99948 |
The capacity of alternative data perturbation configurations within the LIME architecture to accurately mirror the internal logic of the base models serves as a direct index of explanatory fidelity. This dimension of diagnostic accuracy is evaluated via the mean R^2 coefficient, which charts the precision with which the localized LIME proxy model tracks the complex decision surfaces of the primary black-box engines. An increased R^2 index indicates superior fidelity, demonstrating a tighter structural fit between the simplified surrogate framework and the baseline algorithm.
Table 4 organizes the mean explanation fidelity (R^2) computed for the local proxy networks generated by LIME under alternative probability frameworks.
Table 4. Average explanation fidelity (R^2) across models and sampling distributions.
Sampling Distribution | CATB | XGB | RF | KNN | DT |
Pareto (α = 3, c = 1) | 0.4166 | 0.1934 | 0.4342 | 0.9971 | 0.9267 |
Pareto (α = 5, c = 1) | 0.4529 | 0.2075 | 0.4197 | 0.9968 | 0.9264 |
Pareto (α = 7, c = 1) | 0.4989 | 0.2289 | 0.4811 | 0.9968 | 0.9263 |
Pareto (α = 4, c = 1) | 0.4230 | 0.2018 | 0.4215 | 0.9969 | 0.9264 |
Pareto (α = 6, c = 1) | 0.4789 | 0.2169 | 0.4381 | 0.9965 | 0.9262 |
Beta (α = 0.5, β = 0.5) | 0.2925 | 0.3231 | 0.3574 | 0.7190 | 0.8609 |
Weibull (k = 0.1, c = 1) | 0.5511 | 0.6042 | 0.4511 | 0.9403 | 0.9265 |
Gamma (α = 1, θ = 1) | 0.3031 | 0.1591 | 0.3325 | 0.8144 | 0.8266 |
Weibull (k = 0.8, c = 1) | 0.2988 | 0.1449 | 0.3232 | 0.7864 | 0.7858 |
Weibull (k = 0.5, c = 1) | 0.2943 | 0.1365 | 0.2946 | 0.7242 | 0.7280 |
Weibull (k = 0.4, c = 1) | 0.2997 | 0.1569 | 0.3117 | 0.7029 | 0.7289 |
Weibull (k = 0.7, c = 1) | 0.2944 | 0.1394 | 0.3137 | 0.7645 | 0.7548 |
Gaussian | 0.0683 | 0.0493 | 0.1335 | 0.4855 | 0.1579 |
Grey-filled cells indicate the highest average explanation fidelity (R^2) for each model.
The empirical data demonstrates that every selected parametric configuration (encompassing the Pareto, Weibull, Beta, and Gamma formulations) drastically outpaces the traditional Gaussian mechanism when charting the internal decision paths of the base classifiers. Specifically, the Pareto model (shape = 3) yields the peak R^2 metric when evaluating both the Decision Tree (0.9267) and K-NN (0.9971) architectures, whereas the Weibull curve (shape = 0.1) records the maximum diagnostic fidelity alongside the XGB engine (0.6042).
However, these fidelity indices undergo a clear drop as the mathematical complexity of the primary system scales upward; both XGB and Random Forest record suppressed R^2 values across all evaluated probability curves, highlighting the steep geometric challenges LIME faces when attempting to linearly map highly intricate decision surfaces. These outcomes underscore that aligning the underlying data-variation models with the actual geometric contours of the telemetry repository generates major gains in explanation fidelity, particularly across structurally direct architectures like Decision Trees and K-NN. Figure 3 aggregates the independent R^2 indices computed for the Weibull and Pareto formulations, mapping the macro-level shifts in fidelity observed across the diverse classifiers.
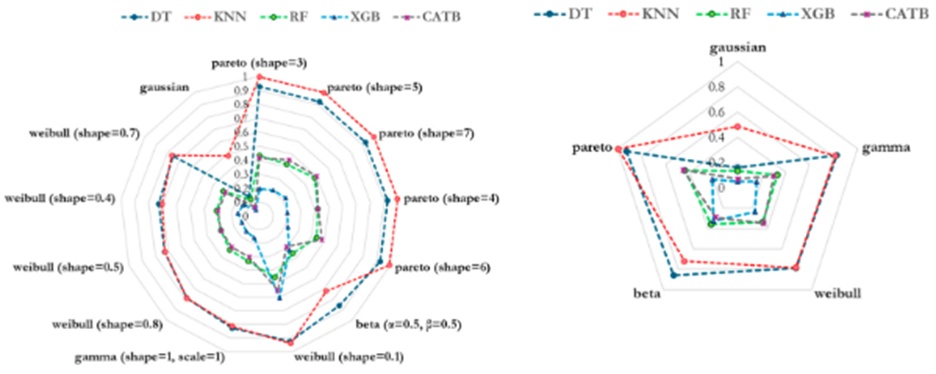
Figure 3. Average explanation fidelity (R2) across models and sampling distributions. Left: R2 scores for individual distribution parameterizations. Right: Averaged R2scores for each distribution family.
Measuring the consistency of generated diagnostics inside the LIME architecture serves as a vital benchmark for evaluating its overall operational resilience and reproducibility. This explanatory stability is quantified by calculating the convergence of LIME outputs when the target records are exposed to minor localized data variations or alternative sampling constraints. An elevated stability rating points to a highly dependable diagnostic profile, showing that the model's localized explanation remains uncorrupted by minor data shifts, thereby establishing user trust in its utility during critical security operations.
Table 5 tracks the stability metrics (S) recorded for LIME-derived explanations across diverse combinations of machine learning models and distribution models, evaluated by computing the Jaccard similarity index across the top 10 prioritized features.
The Pareto distribution family consistently captures the top stability benchmarks across all evaluated algorithms, displaying high performance when paired with structurally simpler systems like K-NN (S > 0.99) and Decision Trees (S > 0.97). Similarly, both the Beta and Gamma formulations demonstrate a major performance advantage over the traditional Gaussian baseline; the Beta distribution yields high architectural consistency for Decision Trees, while the Gamma model demonstrates clear compatibility with Random Forest frameworks.
The Decision Tree model records the most dramatic swings in explanation consistency, spanning from a minimum score of S = 0.7099 (under standard Gaussian sampling) to a peak score of S = 0.9797 (utilizing Pareto sampling), an outcome that underscores its direct sensitivity to the geometric properties of the variation engine. In contrast, highly sophisticated classifiers like XGB and RF exhibit minimized variance across the different distributions, though their overall baseline stability scores remain generally suppressed. The CATB model exhibits a pattern that closely follows the behavior of XGB and RF, sustaining a relatively uniform degree of explanation consistency across most mathematical models, but demonstrating a clear drop in stability under Weibull and Gaussian sampling operations.
Table 5. Average explanation stability (S) across models and sampling distributions.
Sampling Distribution | CATB | DT | KNN | XGB | RF |
Pareto (α = 3, c = 1) | 0.8314 | 0.9797 | 0.9897 | 0.8207 | 0.8064 |
Pareto (α = 5, c = 1) | 0.8197 | 0.9779 | 0.9907 | 0.8032 | 0.7952 |
Pareto (α = 7, c = 1) | 0.8161 | 0.9777 | 0.9901 | 0.7967 | 0.7720 |
Pareto (α = 4, c = 1) | 0.8215 | 0.9788 | 0.9902 | 0.8120 | 0.7999 |
Pareto (α = 6, c = 1) | 0.8153 | 0.9765 | 0.9904 | 0.8089 | 0.7781 |
Beta (α = 0.5, β = 0.5) | 0.8788 | 0.9516 | 0.8780 | 0.8111 | 0.7910 |
Weibull (k = 0.1, c = 1) | 0.6877 | 0.9227 | 0.9180 | 0.7125 | 0.6256 |
Gamma (α = 1, θ = 1) | 0.9034 | 0.9128 | 0.8880 | 0.8075 | 0.7960 |
Weibull (k = 0.8, c = 1) | 0.8808 | 0.8940 | 0.8884 | 0.7925 | 0.8011 |
Weibull (k = 0.5, c = 1) | 0.7874 | 0.8981 | 0.8585 | 0.7482 | 0.7665 |
Weibull (k = 0.4, c = 1) | 0.7412 | 0.8928 | 0.8488 | 0.7149 | 0.7509 |
Weibull (k = 0.7, c = 1) | 0.8542 | 0.8905 | 0.8913 | 0.7879 | 0.7864 |
Gaussian | 0.7624 | 0.7099 | 0.7788 | 0.7507 | 0.7895 |
Grey-filled cells indicate the highest average explanation stability (S) for each model.
By averaging the independent data tracks across the distinct parameter settings for both the Pareto and Weibull families, Figure 4 illustrates the macro-level advantage of the Pareto distribution in formulating highly resilient LIME explanations on this network dataset.
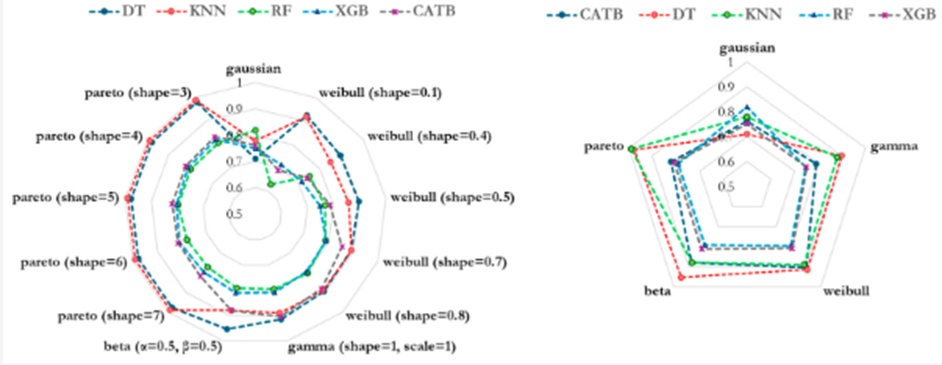
Figure 4. Average explanation stability (S) across models and sampling distributions. Left: stability (S) scores for individual distribution parameterizations. Right: Averaged stability (S) scores for each distribution family.
The iteration-level stability of interpretations generated for a Decision Tree model processing a "Benign" class data record is illustrated in Figure 5. The horizontal bar charts on the left map out the top 10 targeted features alongside their calculated importance weights across the initial and subsequent evaluation cycles for a uniform data point. In Subfigure (a) (focusing on the Gaussian distribution framework), the features ranked fifth and sixth in overall influence drop out completely between consecutive operations, demonstrating high variance in feature prioritization hierarchies. Conversely, in Subfigure (b) (focusing on the Pareto distribution framework, shape = 3), the top 10 explanatory parameters remain perfectly identical across independent operations, demonstrating a superior degree of stability.
On the right side, the Jaccard similarity matrix provides a quantitative evaluation of the paired convergence recorded across all 30 independent evaluation runs. The standard Gaussian framework generates significantly deflated similarity metrics, capturing the heightened volatility of its explanatory outputs; in contrast, the Pareto distribution maintains highly consistent and elevated similarity scores, verifying the interpretive stability illustrated in the paired feature graphs.
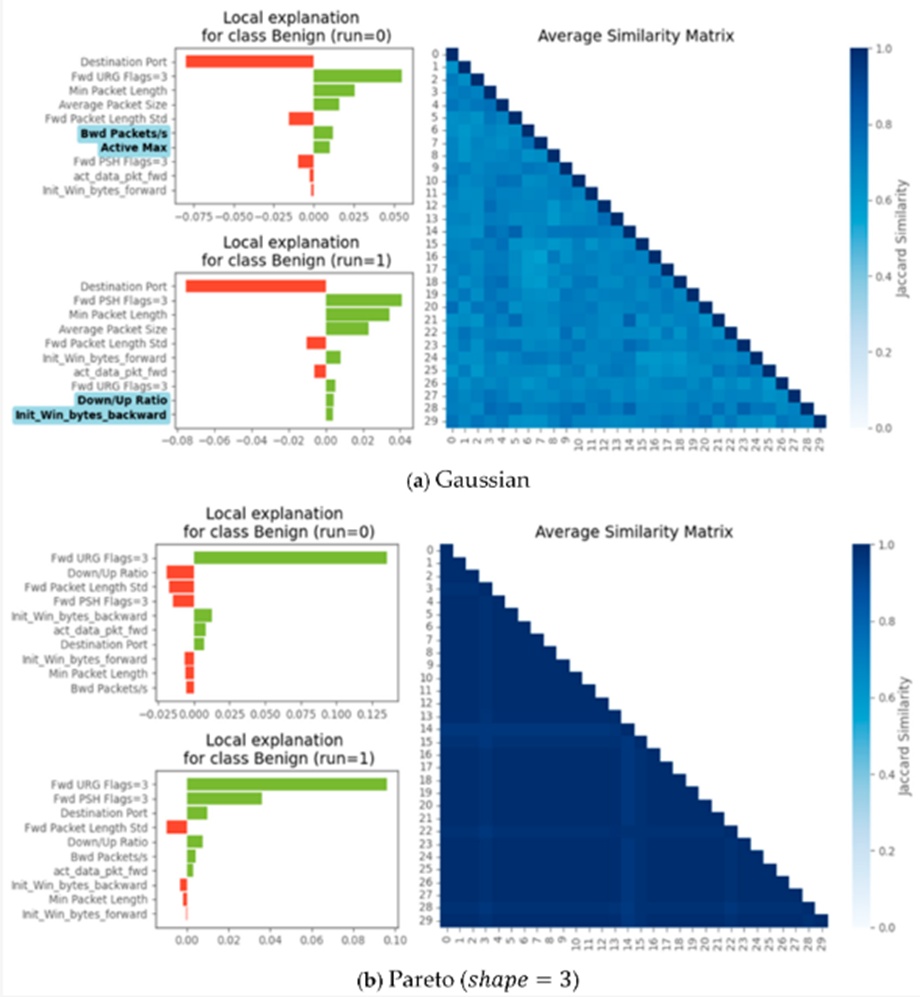
Figure 5. Run-level explainability stability: Gaussian vs. non-Gaussian distributions. Left: Top 10 features and their explanation scores for the first and second explain runs of the same instance. Features highlighted in blue appear in one run but not the other. Right: JS matrix showing pairwise similarities across runs (n = 30). Subfigure (a) corresponds to the Gaussian distribution, and subfigure (b) to the Pareto distribution (shape = 3). The explained model is a DT, and the test data instance is from the “Benign” class.
Table 6 provides a comparison of sampling distributions based on their summed ranks for the average fidelity (R^2) and stability (S) of LIME across models. For our dataset, Pareto distributions consistently perform the best when considering both metrics. Pareto (shape = 3) has the lowest summed rank, indicating it achieves the best overall balance between fidelity and stability, closely followed by Pareto (shape = 7). In contrast, Gaussian has the highest summed rank, ranking last in both fidelity and stability, reinforcing its limitations as the default perturbation distribution. These summed rank comparisons clearly demonstrate that Pareto distributions are the most effective for generating both stable and high-fidelity LIME on this dataset.
Table 6. Averaged stability and fidelity of explanations across models.
Distribution | Rank (𝑺) | Avg of Stability (𝑺) | Rank (𝑹𝟐) | Avg of Fidelity (𝑹𝟐) |
Pareto (shape = 3) | 1 | 0.8856 | 6 | 0.5936 |
Pareto (shape = 5) | 3 | 0.8773 | 4 | 0.6007 |
Pareto (shape = 7) | 5 | 0.8705 | 2 | 0.6264 |
Pareto (shape = 4) | 2 | 0.8805 | 5 | 0.5939 |
Pareto (shape = 6) | 4 | 0.8739 | 3 | 0.6113 |
Beta (α = 0.5, β = 0.5) | 6 | 0.8621 | 7 | 0.5106 |
Weibull (shape = 0.1) | 12 | 0.7733 | 1 | 0.6946 |
Gamma (shape = 1, scale = 1) | 7 | 0.8615 | 8 | 0.4871 |
Weibull (shape = 0.8) | 8 | 0.8514 | 9 | 0.4678 |
Weibull (shape = 0.5) | 10 | 0.8118 | 12 | 0.4355 |
Weibull (shape = 0.4) | 11 | 0.7897 | 11 | 0.4400 |
Weibull (shape = 0.7) | 9 | 0.8421 | 10 | 0.4534 |
Gaussian | 13 | 0.7642 | 13 | 0.1789 |
The empirical findings from this research indicate that evaluating individual disturbance methodologies tailored to each independent attribute would serve as a valuable path for future exploration. This methodology would facilitate the creation of data-alteration frameworks that are more closely aligned with the unique distributional and geometric properties of specific variables. Consequently, such an approach would enhance the robustness and transparency of the LIME architecture when processing heterogeneous data repositories containing a blend of continuous, categorical, and binary attributes, as it permits a more precise replication of authentic data configurations during the perturbation phase.
When structuring perturbation techniques for categorical attributes, the discrete and non-continuous essence of these variables must be carefully factored into the design. Selecting categories at random based on their empirical frequencies or enforcing domain-specific operational constraints could serve to preserve structural data integrity. To guarantee that prevalent categories are altered with a proportionally higher frequency, researchers can implement frequency-weighted sampling routines. It is likewise advisable to integrate methodologies that generate more plausible category configurations while preventing the introduction of conflicting or illogical data states.
Furthermore, network data frameworks regularly contain binary indicators; thus, the perturbation mechanism can be engineered to invert the target value (transitioning from 0 to 1, or the reverse) utilizing a probability matrix that mirrors the baseline distribution of that binary class within the broader repository. Additionally, it is highly practical to analyze advanced strategies such as class-conditional data variations and structured noise injection within binary parameters, allowing investigators to thoroughly audit the primary model's sensitivity to minor contextual adjustments.
This investigation confronts the vital obstacles surrounding the interpretability of machine learning architectures within the domain of network intrusion detection, particularly when implemented alongside complex, asymmetrical repositories like CIC-IDS-2018. Although predictive frameworks such as k-Nearest Neighbors, Decision Trees, Random Forests, and XGB exhibit exceptional capability in isolating malicious network communication patterns, the opaque, black-box character of these systems frequently constrains their real-world integration into defensive cybersecurity environments, where transparency and operational trust are indispensable. Local Interpretable Model-agnostic Explanations (LIME), a standard post-hoc diagnostic tool, was systematically audited to expose its foundational flaws when interacting with data frameworks defined by non-Gaussian distributions, which represent a common reality in authentic network telemetry.
To address these vulnerabilities, this study introduced an adapted LIME architecture that integrates alternative data-variation sampling frameworks—specifically leveraging Pareto, Weibull, Beta, and Gamma distributions—to establish a more precise alignment with the true properties of the underlying data. The gathered experimental metrics reveal that these structural adjustments yield major improvements in both the explanation fidelity and consistency of the diagnostics when contrasted against the standard default Gaussian perturbation model. Most notably, the Pareto distribution family demonstrated the most optimal convergence of fidelity and stability across the various evaluated machine learning algorithms, highlighting its direct compatibility with high-dimensional, highly skewed datasets.
The computational assessment indicators, specifically tracking explanation fidelity (R^2) and stability (S), recorded distinct optimization trends, which were most pronounced when paired with structurally simpler classifiers such as Decision Trees and k-Nearest Neighbors. Conversely, establishing equally elevated baselines of fidelity and consistency remains an ongoing challenge when evaluating more intricate architectures like XGB and Random Forests, both of which produce highly convoluted, non-linear classification boundaries.
This study advances the interpretability of automated intrusion detection frameworks by elevating the diagnostic quality of explanations formulated for machine learning systems. These algorithmic enhancements not only assist security specialists in auditing and optimizing automated decision pathways but also cultivate greater systemic trust during live deployments within critical cybersecurity operations. Future research initiatives will target the continuous refinement of attribute-specific perturbation models and explore integrated hybrid explanation strategies to scale these interpretability benefits to highly intricate models and fluid, real-time network infrastructures.
None
None
This research/project was co-funded by the European Union under Horizon Europe program grant agreement No. 101059903, the European Union funds for the period 2021–2027, and the state budget of the Republic of Lithuania financial agreement No. 10-042-P-0001.
None
Open Access The author(s) retain copyright. This article is licensed under the Creative Commons Attribution-NonCommercial-ShareAlike 4.0 International License. It may be shared and adapted for non-commercial purposes with appropriate attribution, an indication of changes, and distribution of adaptations under the same license. Third-party material may be subject to separate terms identified in its credit line. View the license at https://creativecommons.org/licenses/by-nc-sa/4.0/.
 Transparent Intelligence Publishing