Graph neural networks (GNNs) have been successfully deployed across numerous practical domains, yet the precise mechanisms underlying their operations remain largely opaque. In response to this lack of clarity and to encourage the deployment of reliable AI systems, a variety of GNN explanation tools have been developed. Nonetheless, current interpretation techniques frequently encounter severe bottlenecks, including: (1) explanations that are restricted to localized individual instances; (2) poor generalizability when applied to unfamiliar graph structures; (3) the risk of creating structurally invalid graphs; and (4) confinement to specific task domains (such as only node or only graph classification). To resolve these deficiencies, we introduce a novel interpretation framework, GAN-GNNExplainer, which integrates a generator to construct explanations alongside a discriminator to supervise the production stage, thereby enhancing output dependability. Although advantageous, GAN-GNNExplainer still exhibits limitations in producing highly faithful explanations and shows suboptimal performance when tested on empirical datasets. To rectify these weaknesses, we present ACGAN-GNNExplainer, an advanced iteration that enhances GAN-GNNExplainer by utilizing a more robust discriminator to continuously monitor the generation phase, which yields explanatory outputs that are both dependable and faithful. Comprehensive empirical evaluations conducted on both artificial and empirical graph datasets confirm that our proposed methodologies outperform conventional GNN explanation frameworks.
Graph neural networks (GNNs) have progressed rapidly as a potent methodology for analyzing network-structured data, demonstrating exceptional utility across a diverse range of practical domains, such as criminal activity forecasting [1], traffic flow modeling [2], event prediction [3], and clinical diagnostics [4]. GNNs possess a strong capacity for modeling intricate node relationships and isolating meaningful representations from graph architectures, positioning them as an optimal choice for analytical problems requiring graph-centric evaluations.
Despite the impressive performance metrics achieved by GNNs, their internal opacity diminishes their trustworthiness within sensitive domains like healthcare and finance. The fundamentally black-box nature of GNN architectures obfuscates their internal decision-making pathways, thereby hindering the capacity to interpret the rationale behind specific predictions or to identify underlying biases. These vulnerabilities have impeded the broader integration of GNNs into critical fields where interpretability and operational transparency are paramount, such as medical services [5], recommender engines [6], and related disciplines.
To mitigate this bottleneck, a broad assortment of GNN explanation techniques has been developed to illuminate the internal logic of GNN frameworks. These methodologies formulate explanations at either the node or whole-graph level, assisting researchers in identifying the critical structural components and features that drive model predictions. More precisely, generating explanations for GNN models is highly encouraged—and frequently mandated—to bolster user trust in model outputs, secure the safety of deployed applications, and foster the development of responsible artificial intelligence (AI) [7, 8].
The task of interpreting GNN decisions has garnered considerable research attention, resulting in the development of numerous explanatory frameworks [9-13] over recent years. While these approaches offer valuable insights into intricate GNN architectures, their practical utility remains constrained by several inherent flaws: (1) the scope of the explanation is confined to a singular instance; (2) the derived explanations cannot be easily transferred to novel, unseen graphs; (3) the generated output might violate basic structural rules of valid graphs; and (4) the framework may be restricted to an individual task category (e.g., exclusively node classification or graph classification). For instance, the pioneering GNNExplainer method [9] is restricted to local evaluations and suffers from a lack of scalability. Subsequently, XGNN [13] bypassed this scale constraint by optimizing a graph generator to interpret entire classes through the identification of class-specific structural topologies. Nevertheless, it still lacks generalizability and, more critically, risks synthesizing influential subgraphs that do not naturally exist. The more recent Gem framework [12] lessened some of these historical constraints, yet its explanatory precision fluctuates across different tasks and lacks stability due to the stochastic nature of its generative process.
To overcome these current limitations, this paper presents two innovative GNN interpretation frameworks: GAN-GNNExplainer and ACGAN-GNNExplainer [14], both of which utilize generative principles to formulate explanations for GNN models. Each of our proposed designs is built upon a generator-discriminator pair. Specifically, within the GAN-GNNExplainer framework, the generator learns to synthesize explanations tailored to an input graph G that requires interpretation. Simultaneously, the discriminator differentiates between "authentic" and synthesized explanations. The discriminator offers critical feedback to the generator, thereby optimizing the explanation synthesis. Through iterative adversarial training between these two components, the generator eventually learns to output explanations that closely match the targeted "authentic" instances. Consequently, the qualitative standard of the explanations is heightened, generating a substantial increase in overall explanatory accuracy. While GAN-GNNExplainer marks a major step forward in interpretation accuracy and successfully resolves several constraints of prevalent GNN explainers, it demonstrates insufficient reliability and a lack of fidelity when evaluated on real-world datasets.
To remedy these remaining flaws, we introduce an upgraded architecture, ACGAN-GNNExplainer, which adopts the Auxiliary Classifier Generative Adversarial Network (ACGAN) [15] as its foundational backbone to synthesize GNN interpretations. Specifically, the target graph G, paired with its corresponding label (𝐺) as determined by the target GNN model f, serves as the input for the generator, which subsequently learns to construct explanations. To guarantee the structural validity and precision of the synthesized subgraph, an adversarial discriminator is integrated into the architecture. This discriminator distinguishes between genuine and synthesized explanations, assigns a predicted class label to each evaluation, and provides iterative feedback to the generator, thereby supervising the entire production cycle. Broad experimentation across both synthetic and real-world benchmarks validates the efficacy of our framework, demonstrating its superior performance relative to standard GNN interpretation methodologies.
The primary contributions of this study are outlined below:
We introduce a novel interpretation framework named GAN-GNNExplainer, engineered specifically for GNN architectures. This technique utilizes a generator to construct explanations under the supervision of a discriminator, ensuring dependable outcomes throughout the training process.
Furthermore, we present ACGAN-GNNExplainer, a highly advanced interpretation system for GNNs. This model employs an interconnected generator and discriminator system that continuously monitors the generation pipeline, culminating in explanations that achieve high levels of both reliability and fidelity.
Our methodologies are rigorously verified across a diverse set of graph benchmarks, comprising both synthetic and real-world datasets, and spanning multiple operational tasks such as node and graph classification. The empirical findings consistently confirm the benefits of our designs over contemporary alternatives.
Generative Adversarial Networks (GANs) [16] consist of two primary modules: a generator and a discriminator, which undergo simultaneous training in a competitive framework. Initialized with random noise, the generator learns to synthesize artificial samples that mimic the true data distribution, whereas the discriminator is tasked with distinguishing between authentic data and the synthetic outputs produced by the generator. Throughout training, the generator strives to formulate increasingly authentic samples, rendering it more difficult for the discriminator to make correct distinctions. This adversarial interplay has enabled GANs to achieve remarkable breakthroughs across diverse domains, including image synthesis, data augmentation, and cross-modal tasks.
Over time, numerous GAN variants have been introduced to address challenges like training instability and mode collapse, while simultaneously enhancing the diversity and fidelity of the synthesized outputs. These breakthroughs involve modifications to network topologies, loss objectives, and optimization tactics. For example, conditional GANs (CGANs) [17] integrate a conditioning framework where supplementary information (such as class labels) is delivered to both the generator and discriminator, permitting the generation of class-specific data points. This conditional configuration facilitates more directed generation tasks, boosting sample variety and practical utility.
In a parallel line of research, architectures like InfoGAN [18] investigate the disentanglement of latent representations. By maximizing the mutual information between a designated portion of the latent variables and the synthesized samples, InfoGAN acquires the capacity to manipulate distinct attributes of the generated data, thereby enhancing interpretability. This provides an extra degree of control over the generative process, allowing for the isolation and modification of specific sample characteristics, such as object style or orientation.
Expanding upon the concept of conditional generation, the Auxiliary Classifier Generative Adversarial Network (ACGAN) [15] integrates an auxiliary classification objective to further refine the generative process. ACGAN incorporates class labels directly into the generation pipeline, requiring the discriminator not only to differentiate between real and synthesized data but also to categorize the samples into their correct target classes. This dual requirement enhances both the qualitative standard of the generated samples and their alignment with the designated class labels. Consequently, ACGAN has been widely adopted in domains demanding meticulous control over the generative output, such as medical imaging [19] and other domain-specific scenarios [20].
These continuous innovations have greatly broadened the utility and capacity of GAN models, transforming them into flexible instruments for an array of functional use cases, ranging from creative domains like art generation to critical fields such as medicine and security systems. The ongoing advancement of GAN frameworks and methodologies guarantees their continued relevance in addressing increasingly intricate data synthesis challenges.
GNNs represent a robust class of deep learning architectures engineered to process graph-structured data, such as social networks, citation networks, and molecular topologies. Unlike conventional neural networks that operate on data structured as vectors or matrices, GNNs process graph data directly by aggregating and integrating features from neighboring nodes and edges. GNNs have achieved outstanding benchmarks across multiple tasks, including node classification [21], graph classification [22], and link prediction [23].
In addition to their strong theoretical underpinnings, GNNs are extensively deployed in practical domains. For instance, Wang et al. [24] developed a homophily-based constraint to optimize region graphs for the prediction of criminal activities. This technique constrains neighboring region nodes within the graph to display analogous crime patterns, adhering to the diffusion convolution framework. GNNs are likewise utilized in traffic forecasting [24] and clinical diagnosis [25], showcasing their versatility in real-world environments.
Similar to various other deep learning models, GNNs suffer from a significant limitation: they are commonly treated as black-box systems that lack human-interpretable explanations. Without a comprehensive understanding and verification of the internal workflows of GNNs, their deployment in high-stakes fields involving equity, privacy, and safety is severely constrained. Consequently, engineering explainable GNN models has emerged as a vital area of academic research.
Elucidating the underlying logic of GNNs is an essential but intricate undertaking, as it directly supports the interpretability, reliability, and security of these architectures. In recent years, an assortment of strategies has been proposed to address this issue, capitalizing on the unique structural and relational attributes of graphs to yield expressive explanations. Below, we review several pivotal methodologies that have driving this research area forward.
GNNExplainer [9] is one of the foundational frameworks established for GNN interpretation, focusing on isolating the vital subgraphs and node features that dictate a model's prediction. This approach delivers instance-specific explanations, offering clarity on how localized patterns within the graph impact separate decisions. PGExplainer [11] expands upon this paradigm by generating probabilistic explanations that generalize across multiple instances. Dissimilar to GNNExplainer, it functions at a global, model-wide level, rendering it adaptable to diverse environments.
Advancing the domain further, the authors in [12] introduced a generative methodology, Gem, capable of delivering both local and global explanations. Its inductive formulation permits it to operate without requiring the retraining of the underlying GNN, yielding enhanced flexibility for real-time applications. OrphicX [26] builds on this principle by generating causal explanations, focusing on latent factors to provide a deeper understanding of the cause-and-effect relationships governing GNN predictions. Nonetheless, despite their valuable contributions, both Gem and OrphicX face difficulties when deployed on real-world datasets, particularly regarding the preservation of explanation accuracy. In our study, however, we seek to transcend these bottlenecks by introducing novel explainers capable of delivering high-fidelity explanations across both synthetic and real-world datasets.
Beyond these strategies, reinforcement learning has also been investigated as an instrument for explaining GNN decisions. For instance, XGNN [13] is a model-level interpreter that utilizes a graph generator to identify patterns that maximize the model's predictive performance, thereby highlighting important graph topologies. Another prominent methodology, RC-Explainer [27], integrates causal analysis within a reinforcement learning framework to identify causal dependencies in GNN predictions. Furthermore, RG-Explainer [28] improves upon this by using reinforcement learning to construct explanations that generalize effectively in inductive environments, demonstrating robust capabilities across varied use cases.
Concurrently, an independent line of research concentrates on generating counterfactual explanations, which provide alternative scenarios to clarify model behavior. CF-GNNExplainer [29] is notable for synthesizing counterfactual explanations for the majority of GNN instances, thereby emphasizing the pivotal features that would alter a prediction outcome. Analogously, RCExplainer [30] constructs resilient counterfactual explanations, while ReFine [31] leverages a multi-grained strategy that introduces pretraining and fine-tuning stages to boost the precision and granularity of its explanations.
Comprehending and clarifying the underlying mechanisms of graph neural networks (GNNs) are essential for gaining insights into their internal operations. Interpretation is directed at revealing the model's decision-making pathway, highlighting the transparency and traceability of these processes. Conversely, explanation reinforces GNN predictions by delivering a structured and logical justification for the produced outcomes.
The primary objective of this study is to isolate the specific subgraphs that exert a substantial impact on the predictions of a GNN. A graph is formally defined as G=(V,A,X,L), where V represents the set of nodes, 𝐴∈0,1 signifies the adjacency matrix with 𝐴𝑖𝑗 =1 denoting an edge connecting node i and node j, and 𝐴𝑖𝑗 =0 indicating its absence. The feature matrix of the graph G is denoted by X, and L corresponds to the class label. The function f represents the GNN model, formulated as (𝐺)→𝑌.
We define ((𝐺),)→𝐺𝑠 as the explanation produced by a GNN explanation mechanism. Ideally, supplying this explanation as an input to the target GNN model f should yield an identical prediction Y, which implies ((𝐺),)→𝐺𝑠. Additionally, the generated explanation ((𝐺),)→𝐺𝑠 must constitute a legitimate subgraph of the initial graph G, satisfying the condition 𝐺𝑠⊆𝐺.
This research aims to uncover the foundational logic governing the predictions generated by a target GNN model f. Rather than investigating the internal architecture of f, we interpret it as a black box, concentrating on identifying the subgraphs that notably alter its prediction outcomes. To accomplish this, we utilize a generative framework designed to autonomously construct pertinent subgraphs or explanations. For this generative system to formulate highly accurate explanations, it must be trained using ground-truth or "real" reference data. In practical scenarios, however, such data are frequently unavailable. To surmount this constraint, we implement Granger causality [32], an established technique used to evaluate whether one variable possesses a causal relationship with another, thereby facilitating the creation of valid and dependable explanations.
Throughout our experimental procedures, individual edges are isolated and masked systematically to evaluate their influence on the target predictions of the GNN. By analyzing the variance in prediction probabilities between the intact and masked graphs, we quantify the specific contribution of each edge to the model's output, assigning weights proportional to the recorded differences. These calculated weights serve to rank the edges, where the highest-ranking edges constitute the core explanations (i.e., the critical subgraphs). Nonetheless, directly implementing Granger causality to interpret a GNN model f can introduce significant computational overhead and restrict generalizability. Our strategy mitigates these drawbacks by employing a parameterized explainer designed to detect recurring patterns across structurally comparable graphs. Once these patterns are acquired, the explainer can be applied to unexamined graphs, thereby enhancing both operational efficiency and scalability.
In this section, we present GAN-GNNExplainer, a GAN-based explanatory framework for GNNs that capitalizes on the generative properties of generative adversarial networks. The architecture is composed of two primary elements: a generator (𝒢1) and a discriminator (𝒟1), as depicted in Figure 1.
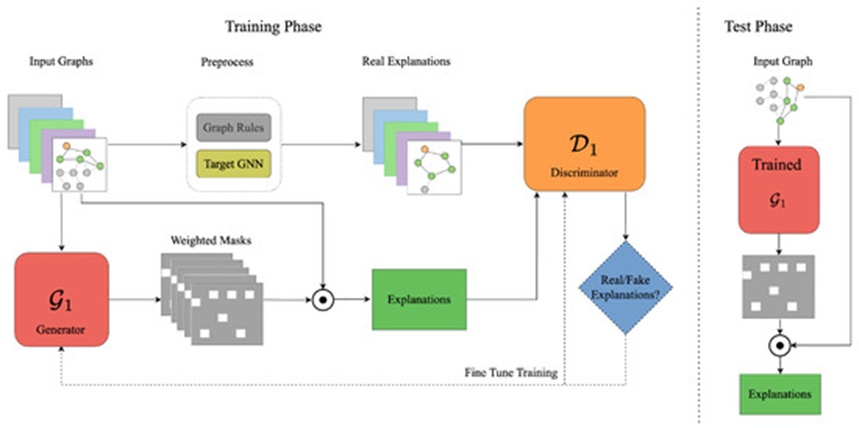
Figure 1. The framework of GAN-GNNExplainer. The ⊙ symbol represents element-wise multiplication. The framework has two stages: Training and Testing. During the Training Phase, the goal is to optimise the generator and discriminator components of the GAN-GNNExplainer model. After successful training, the Testing Phase uses the trained generator to produce explanations for test data.
In contrast to conventional GAN training procedures where the generator 𝒢 receives random noise z as input, our architecture supplies 𝒢 with the intact graph G that requires explanation. This design guarantees that the generator 𝒢 outputs a corresponding explanation mapped directly to the original input graph G. Furthermore, a generator 𝒢 trained through this approach can readily generalize to unfamiliar graphs without necessitating substantial retraining, thereby reducing computational requirements. For our generator 𝒢, we implement an encoder–decoder framework wherein the encoder projects the initial input graph G into a condensed hidden representation, and the decoder subsequently reconstructs the explanation from this latent space. Within this setup, the reconstructed explanation manifests as a mask representing the relative importance of each edge. When conducting evaluations on synthetic datasets, we utilize a six-layer encoder coupled with a two-layer decoder; for real-world datasets, the decoder complexity is preserved while the encoder architecture is expanded, resulting in a seven-layer encoder.
In theory, 𝒢1 is capable of producing both valid and invalid explanations, which can undermine the objective of precisely interpreting a GNN. To regulate this generation process, a discriminator 𝒟1 is integrated into the system. Serving as a graph classifier, 𝒟1 processes both the "real" target explanations and the explanations produced by the generative component. Its primary function is to distinguish between "real" and generated explanations, guiding the generator to output dependable results.
To execute the training of 𝒢1 and 𝒟1, the "real" target explanations must be established beforehand. This is accomplished during a preprocessing phase within our architecture (Figure 1), where Granger causality establishes the "real" explanations to serve as ground truth for training the discriminator. Following the identification of the input graph G and its paired subgraph, the framework is trained to output a weighted mask highlighting the critical edges and nodes within G that heavily dictate the decision-making process of the GNN model f. Applying this weighted mask to the adjacency matrix enables the extraction of corresponding explanations or core subgraphs. These explanations are vital for understanding the underlying logic behind the intricate predictions of the GNN model.
Within a standard GAN structure, the generator (𝒢) and the discriminator (𝒟) engage in a zero-sum minimax game, contesting against one another. The generator learns to approximate the latent distribution of the training data to output "fake" samples designed to misinform the discriminator into classifying them as authentic. The objective function of this minimax game is formulated in Eq. 1:
 (1)
where G denotes the original graph requiring explanation and 𝐺𝑔𝑡 signifies its corresponding ground-truth explanation (i.e., the highly influential subgraph).
When relying solely on Eq. 1 as the objective function to simultaneously train 𝒢1 and 𝒟1 , empirical observations indicate that the accuracy of the final explanation remains suboptimal. We hypothesize that this occurs because Eq. 1 lacks an explicit mechanism to encode the predictive accuracy of the explanation relative to the target GNN model. To mitigate this constraint and elevate explanation precision, we explicitly integrate explanation accuracy into our objective function, establishing an optimized GAN-based loss function formalized in Eq. 2:
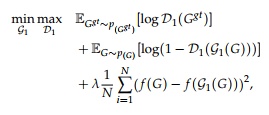 (2)
where f signifies a pre-trained target GNN model, N represents the total node count within the node set of G, and G is the input graph under explanation, while 𝐺𝑔𝑡 serves as its assigned ground-truth explanation (i.e., the critical subgraph). The coefficient acts as a balancing hyperparameter that calibrates the interaction between the GAN framework and the explanation accuracy determined by the pre-trained target GNN f. If is scaled to zero, Eq. 2 simplifies to match Eq. 1.
As emphasized in Section 1, GAN-GNNExplainer introduces a meaningful progression in GNN interpretability, successfully mitigating several constraints observed in prominent contemporary GNN explanation tools. Even so, multiple hurdles remain that require additional investigation, particularly regarding its constrained reliability when applied to real-world datasets and its inadequate fidelity.
Consequently, we direct our attention toward constructing an optimized architecture titled ACGAN-GNNExplainer, which embeds the predicted labels from the target GNN directly into the explanation generation phase. This modification is engineered to elevate performance on real-world datasets, rendering the resulting explanations both more dependable and more faithful.
To overcome the constraints associated with GAN-GNNExplainer, we introduce ACGAN-GNNExplainer, an advanced framework that similarly integrates a generator (𝒢2) and a discriminator (𝒟2). Within this configuration, 𝒢2 is tasked with producing explanations, whereas 𝒟2 is responsible for monitoring and regulating the generation workflow. A comprehensive illustration of the ACGAN-GNNExplainer framework is presented in Figure 2.
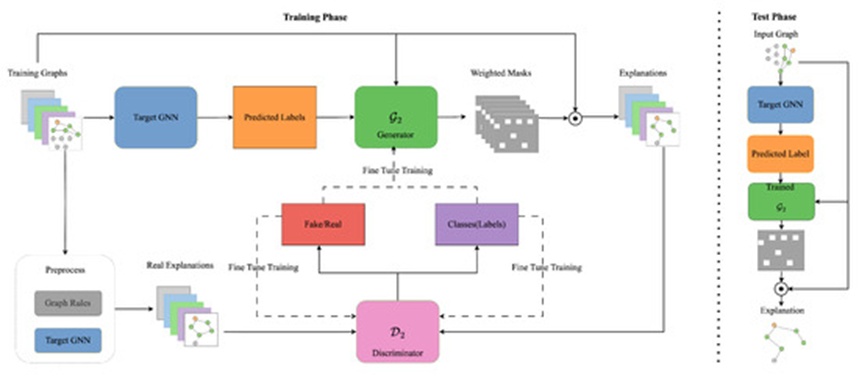
Figure 2. The framework of ACGAN-GNNExplainer. The symbol ⊙ denotes element-wise multiplication. The framework consists of two phases: the Training Phase and the Testing Phase. During the Training Phase, both the generator and discriminator of the ACGAN-GNNExplainer model are trained. Once training is complete, the Testing Phase uses the trained generator to produce explanations for the test data.
In the ACGAN-GNNExplainer model, the generator 𝒢2 is supplied with both the primary input graph G and the predicted label Y that is output by the target GNN model f. This specific setup guarantees that the resulting explanation from 𝒢2 is directly relevant to understanding the predictive behavior of f, given its structural connection to the input graph G. Furthermore, a generator 𝒢2 trained via this technique possesses the capacity to generalize across unfamiliar graph structures without requiring intensive retraining phases, which effectively minimizes computational overhead.
The generator is constructed around an encoder–decoder framework. The encoder maps the input graph G into a condensed hidden representation, while the decoder extracts and reconstructs the explanation from this latent space. In this context, the output explanation is formulated as a mask matrix that reflects the quantitative importance of each individual edge.
Conceptually, the discriminator 𝒟2 acts as an overseer for the generation activities of 𝒢2. It processes both the "real" ground-truth explanations and the generated explanations stemming from 𝒢2, executing a dual task of classifying the data and determining whether an explanation is authentic or synthetic. This classification feedback loop incentivizes 𝒢2 to maximize both the accuracy and the fidelity of its outputs. A preliminary data preprocessing step on the training graphs is executed to establish the "real" explanations, which serve to guide 𝒟2 throughout the training sequence within the ACGAN-GNNExplainer framework.
The generator 𝒢2 constructs explanations or target subgraphs 𝐺𝑠⊆𝐺 based on two primary inputs: the initial graph G and the predicted label Y, formulated as 𝐺𝑠←𝒢2(𝐺,𝑌). Concurrently, the discriminator 𝒟2 computes the source probability (𝑆∣𝐺) (differentiating between "real" and generated configurations) alongside the class classification probability (𝑌∣𝐺), where Y represents the predicted label of graph G, denoted as (𝐺)→𝑌. The objective function for the discriminator is partitioned into two distinct elements: the likelihood of identifying the correct source ℒ𝑆, as specified in Eq. 3, and the likelihood of assigning the correct class ℒ𝑌, as formalized in Eq. 4:
 (3)
 (4)
where G signifies the primary graph requiring explanation, and L represents its corresponding class label.
The discriminator 𝒟2 and generator 𝒢2 participate in a zero-sum minimax optimization process. The principal aim of 𝒟2 is to maximize the likelihood of successfully separating "real" graphs from generated ones (ℒ𝑆) while simultaneously ensuring accurate class label predictions ℒ𝑌 across all samples. This translates to a combined optimization goal of maximizing (ℒ𝑆+ℒ𝑌).
Conversely, the generator 𝒢2 aims to minimize the capacity of 𝒟2 to differentiate between authentic and generated graphs, while concurrently maximizing its own capability to ensure proper class predictions. This yields a combined optimization goal of maximizing (−ℒ𝑆+ℒ𝑌). Consequently, derived from Eqs. 3 and 4, the distinct objective functions for 𝒟2 and 𝒢2 are established in Eq. 5 and Eq. 6, respectively:
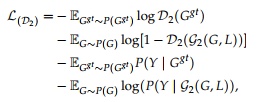 (5)
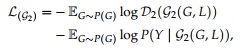 (6)
where G corresponds to the initial graph that requires explanation, and 𝐺𝑔𝑡 signifies its paired empirical explanation (i.e., the actual significant subgraph).
When utilizing the objective functions from Eqs. 5 and 6 to optimize 𝒟2 and 𝒢2, we discover that the fidelity of the resulting explanations does not reach optimal levels. We attribute this outcome to the fact that the generator loss ℒ (𝒢2), as stated in Eq. 6, does not explicitly encapsulate fidelity constraints from the target GNN model f. To counteract this limitation and elevate both explanation fidelity and accuracy, we integrate fidelity parameters directly into the generator's optimization objective. As a result, we formulate an enhanced objective function for 𝒢2, as detailed in Eq. 7:
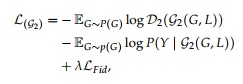 (7)
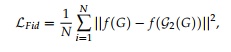 (8)
where ℒ𝐹𝑖𝑑 represents the specific loss component tied to fidelity metrics. The function f denotes a pre-trained target GNN model, N indicates the total count of the node set of G, and G signifies the initial graph under investigation. Correspondingly, 𝐺𝑔𝑡 denotes the ground-truth explanation paired with the graph (i.e., the true influential subgraph). Within this framework, 𝜆 operates as a balancing hyperparameter tasked with calibrating the relative importance between the ACGAN network dynamics and the explanation accuracy derived from the pre-trained target GNN f. Restricting 𝜆 to zero makes Eq. 7 functionally identical to Eq. 6.
In this section, we conduct an extensive empirical assessment of our proposed frameworks, namely GAN-GNNExplainer and ACGAN-GNNExplainer. We begin by presenting the benchmark datasets selected for our evaluation and defining the core implementation parameters. Subsequently, we provide a comparative study of our frameworks against contemporary state-of-the-art GNN explainers, validating their performance across both synthetic and real-world graph contexts.
Datasets. Our empirical validation centers on two frequently utilized synthetic node classification benchmarks, BA-Shapes and Tree-Cycles [9], alongside two real-world graph classification datasets, Mutagenicity [33] and NCI1 [34]. Detailed statistics and characteristics of these datasets are summarized in Table 1.
Table 1. Details of synthetic and real-world datasets.
Dataset Type | NCI1 | Mutagenicity | Tree-Cycles | BA-Shapes |
Number of graphs | 4110 | 4337 | 1 | 1 |
Number of edges | 132,753 | 266,894 | 1950 | 4110 |
Number of nodes | 122,747 | 131,488 | 871 | 700 |
Number of labels | 2 | 2 | 2 | 4 |
The BA-Shapes dataset is built upon a base Barabasi–Albert (BA) graph containing 300 initial nodes. It features 80 "house"-shaped structural network motifs attached arbitrarily to various nodes across the baseline graph structure. Nodes are assigned to one of four classes depending on their structural positioning: the top, middle, or bottom components of the house motif, or as baseline nodes independent of any motif structure.
The Tree-Cycles dataset is constructed from an initial balanced binary tree spanning eight distinct levels. It contains 80 cyclical motifs consisting of six nodes, which are randomly joined to nodes within the foundational tree. Nodes are categorized into two classes based on whether they belong to the base tree structure or the attached cycle motifs.
The Mutagenicity dataset encompasses 4,337 molecular graphs where atoms are mapped as nodes and chemical bonds are defined as edges. These molecular structures are split into two classes, mutagenic and nonmutagenic, denoting their biological effects on the Gram-negative bacterium Salmonella Typhimurium. Structurally, carbon rings integrated with 𝑁𝐻2 or 𝑁𝑂2 groups are known to introduce mutagenic properties. However, because standard carbon rings appear across both mutagenic and nonmutagenic graphs, they lack individual discriminative power.
NCI1 comprises a selected repository of chemical structures evaluated for their performance against non-small-cell lung cancer. It contains more than 4,000 distinct chemical compounds, each labeled with a binary indicator representing positive or negative anticancer activity. Every compound is modeled as an undirected graph structure, where nodes reflect individual atoms, edges represent the connecting chemical bonds, and node labels represent the underlying atomic elements.
Baseline approaches. Following the widespread deployment of GNN architectures across diverse real-world domains, the demand for transparent explainability has expanded considerably, serving as a pillar for improving model clarity and fostering user confidence. In this framework, we select three prominent GNN explanation baselines for comparative verification: GNNExplainer [9], Gem [12], and OrphicX [26]. To ensure a fair and rigorous comparison, we utilize the official software implementations provided by the respective authors.
Different top edges (K or R). Once the relative importance (or numerical weight) of each edge in the input graph G has been determined, identifying the optimal volume of edges to constitute the explanation is essential. Isolating too few edges can lead to incomplete or fragmented explanations, whereas including an excessive number can introduce confounding noise. To address this trade-off, we establish a fixed top K metric for synthetic evaluation and a top ratio (R) metric for real-world scenarios to govern the volume of edges retained in the explanation. We verify the consistency and robustness of our framework by modifying these values across a predefined spectrum. Specifically, we evaluate K={5,6,7,8,9} for the BA-Shapes dataset, K={6,7,8,9,10} for the Tree-Cycles dataset, and R={0.5,0.6,0.7,0.8,0.9} for the real-world datasets.
Data split. To ensure experimental consistency and a fair foundation for comparison, the datasets are partitioned into three distinct subsets: 80% allocated for training, 10% reserved for validation purposes, and 10% dedicated to final testing. The evaluation partition is kept entirely isolated and remains untouched until the final model verification phase.
Evaluation metrics. A proficient GNN explainer must isolate minimal and compact subgraphs while successfully preserving the predictive performance of the model when these explanations are re-routed back into the target GNN. Consequently, it is necessary to appraise explainer performance using a diverse set of evaluation metrics [35]. In our empirical analysis, we measure the accuracy of GAN-GNNExplainer and evaluate both the accuracy and fidelity performance of ACGAN-GNNExplainer.
Specifically, we generate explanation subgraphs for the test partition using GNNExplainer [9], Gem [12], OrphicX [26], GAN-GNNExplainer, and ACGAN-GNNExplainer. These isolated structures are subsequently passed into the pre-trained target GNN model f to calculate the resulting accuracy, which is formally expressed in Eq. 9:
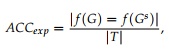 (9)
where G represents the original input graph requiring explanation and 𝐺𝑠 signifies the isolated explanatory output (such as the primary influential subgraph). The numerator expression |(𝐺)=𝑓(𝐺𝑠)| quantifies the total instances where the predictions of the target GNN model f match exactly across both G and Gs, while |T| represents the total size of the evaluation set.
Additionally, fidelity metrics determine how accurately the engineered explanations preserve the indispensable subgraphs of the initial input graph structure. In our experiments, we compute the 𝐹𝑖𝑑𝑒𝑙𝑖𝑡𝑦+ and 𝐹𝑖𝑑𝑒𝑙𝑖𝑡𝑦− metrics [36] to comprehensively evaluate explanation fidelity.
The metric Fidelity+ quantifies the drop in prediction accuracy when critical input features are omitted, contrasting the baseline predictions against those produced via the altered graph structure. Conversely, Fidelity- assesses the shift in prediction accuracy when key features are preserved while non-vital structures are discarded. Taken together, Fidelity+ and Fidelity- deliver a holistic evaluation regarding how accurately the explanations capture the underlying model mechanics and the relative importance of distinct input variables. The mathematical formulations for Fidelity+ and Fidelity- are defined in Eqs. 10 and 11, respectively:
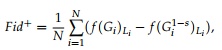 (10)
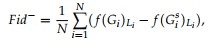 (11)
where N signifies the total sample count and Li represents the target class label for the i-th instance. The expressions (𝐺𝑖) and (𝐺𝑖1−𝑠)𝐿𝑖 correspond to the predicted probabilities for class Li generated by the initial graph Gi and the masked graph, respectively. This masked graph is constructed by removing the critical features (the explanations) pinpointed by the explainers from the baseline graph. Higher values of Fidelity+ are optimal, indicating that the isolated explanation holds greater importance. On the other hand, (𝐺𝑖𝑠) denotes the predicted probability for class Li derived from the explanation subgraph, which retains only the vital substructures identified by the explanation methods. Lower values of Fidelity- are preferable, demonstrating that the explanation graph remains highly sufficient and self-contained.
In brief, the explanation accuracy (𝐴𝐶𝐶𝑒𝑥𝑝) gauges the degree to which the produced explanations align with the predictions of the target model, whereas Fidelity+ and Fidelity- quantify the respective necessity and sufficiency of these explanations. Evaluating and contrasting accuracy and fidelity scores across various framework explainers yields vital insights regarding the capability and appropriateness of each standalone approach.
We initiate our empirical investigation by testing our introduced framework on two standard synthetic benchmarks: BA-Shapes and Tree-Cycles [9]. To evaluate the performance of our proposed GAN-GNNExplainer, we contrast its outcomes against baseline explainers, specifically GNNExplainer and Gem. The accuracy metrics across varying values of K are detailed in Table 2 for the BA-Shapes dataset and Table 3 for the Tree-Cycles dataset.
Table 2. Explanation accuracy on the BA-Shapes dataset. The presented outcomes encompass averages from five runs. Note that the best-performing results have been emphasised in bold.
K (Edges) | 9 | 8 | 7 | 6 | 5 |
GNNExplainer | 0.9118 | 0.9118 | 0.9118 | 0.8824 | 0.7941 |
Gem | 0.9412 | 0.9412 | 0.9412 | 0.9412 | 0.9412 |
GAN-GNNExplainer | 0.9412 | 0.9706 | 0.9706 | 0.9706 | 0.6764 |
Table 3. Explanation accuracy on the Tree-Cycles dataset. The presented outcomes encompass averages from five runs. Note that the best-performing results have been emphasised in bold.
K (Edges) | 10 | 9 | 8 | 7 | 6 |
GNNExplainer | 0.9429 | 0.8571 | 0.7143 | 0.5429 | 0.2000 |
Gem | 0.9428 | 0.8285 | 0.5714 | 0.8285 | 0.7142 |
GAN-GNNExplainer | 1.0000 | 1.0000 | 0.9429 | 0.9715 | 0.9429 |
Reviewing the data for the BA-Shapes benchmark in Table 2, it is evident that our GAN-GNNExplainer routinely achieves superior explanation accuracy across the majority of configurations. While GNNExplainer, Gem, and GAN-GNNExplainer all show competent capabilities on synthetic data, GAN-GNNExplainer incorporates key methodological refinements that optimize its operational success. Furthermore, as demonstrated in Table 3 for the Tree-Cycles benchmark, GAN-GNNExplainer yields substantial performance gains over the baseline frameworks.
It is worth noting that within our tests on the simpler BA-Shapes domain, our GAN-GNNExplainer model exhibits scaling accuracy improvements as K expands, successfully capitalizing on the extra available information. This specific characteristic becomes crucial when transitioning to intricate data settings. Although our framework might require a larger volume of information to reach optimal performance under complex conditions, it possesses the capacity to eclipse Gem by providing enhanced accuracy.
This section outlines the empirical findings obtained from real-world datasets. The quantitative assessments are structured in Tables 4 and 5. As observed from these tables, the documented benchmarks firmly establish that the proposed GAN-GNNExplainer yields explanations with stable, high accuracy across all real-world data configurations when compared to competing explainers.
Table 4. Explanation accuracy on the Mutagenicity dataset. The presented outcomes encompass averages from five runs. Note that the best-performing results have been emphasised in bold.
R (Edge Ratio) | 0.9 | 0.8 | 0.7 | 0.6 | 0.5 |
GNNExplainer | 0.7811 | 0.6935 | 0.6313 | 0.5968 | 0.6175 |
Gem | 0.7903 | 0.7235 | 0.6590 | 0.6014 | 0.5737 |
GAN-GNNExplainer | 0.7598 | 0.7215 | 0.6929 | 0.5956 | 0.5914 |
Table 5. Explanation accuracy on the NCI1 dataset. The presented outcomes encompass averages from five runs. Note that the best-performing results have been emphasised in bold.
R (Edge Ratio) | 0.9 | 0.8 | 0.7 | 0.6 | 0.5 |
GNNExplainer | 0.8127 | 0.7616 | 0.6788 | 0.6107 | 0.5961 |
Gem | 0.8321 | 0.7518 | 0.6837 | 0.6083 | 0.5645 |
GAN-GNNExplainer | 0.7762 | 0.7616 | 0.7105 | 0.6496 | 0.6375 |
Regarding the Mutagenicity benchmark, our proposed architecture surpassed Gem exclusively at the R=0.7 threshold. Conversely, for the NCI1 data collections, our approach yielded superior accuracy relative to Gem across most specified R parameters. The empirical patterns from these real-world benchmarks mirror those seen in the BA-Shapes evaluations, implying that when confronting intricate datasets, supplemental structural details are required to yield precise explanations. Additionally, our observations show that our method holds the potential to deliver higher accuracy scores than Gem when supplied with a greater wealth of information.
To begin, we execute experiments on synthetic benchmarks, specifically BA-Shapes and Tree-Cycles. We analyze the explanation qualities output by GNNExplainer, Gem, OrphicX, and our developed ACGAN-GNNExplainer framework. The comprehensive explanation metrics for these synthetic graphs across distinct configurations of K are tabulated in Tables 6 and 7.
Table 6. The results of explanations on BA-Shapes dataset: 𝐴𝐶(↑), 𝐹𝑖𝑑+(↑), 𝐹𝑖𝑑−(↓). The presented outcomes encompass averages from five runs. Note that the best-performing results have been emphasised in bold. In this table, “Our Method” refers to our proposed method ACGAN-GNNExplainer.
K | Metrics | Our Method | OrphicX | Gem | GNNExplainer |
5 | 𝐴𝑐𝑐𝑒𝑥𝑝 | 0.7941 | 0.7353 | 0.9412 | 0.7941 |
𝐹𝑖𝑑+ | 0.6471 | 0.7941 | 0.5588 | 0.7059 | |
𝐹𝑖𝑑− | 0.1471 | 0.2059 | 0.000 | 0.1471 | |
6 | 𝐴𝑐𝑐𝑒𝑥𝑝 | 0.8529 | 0.7353 | 0.9706 | 0.8824 |
𝐹𝑖𝑑+ | 0.5882 | 0.7941 | 0.5588 | 0.6765 | |
𝐹𝑖𝑑− | 0.0882 | 0.2059 | −0.0294 | 0.0588 | |
7 | 𝐴𝑐𝑐𝑒𝑥𝑝 | 0.9706 | 0.8529 | 0.9706 | 0.9118 |
𝐹𝑖𝑑+ | 0.6176 | 0.7941 | 0.5882 | 0.7059 | |
𝐹𝑖𝑑− | −0.0294 | 0.0882 | −0.0294 | 0.0294 | |
8 | 𝐴𝑐𝑐𝑒𝑥𝑝 | 0.9706 | 0.8824 | 0.9706 | 0.9412 |
𝐹𝑖𝑑+ | 0.6471 | 0.7941 | 0.5882 | 0.7353 | |
𝐹𝑖𝑑− | −0.0294 | 0.0588 | −0.0294 | 0.000 | |
9 | 𝐴𝑐𝑐𝑒𝑥𝑝 | 1.000 | 0.8824 | 0.9706 | 0.9118 |
𝐹𝑖𝑑+ | 0.6471 | 0.7941 | 0.5882 | 0.7353 | |
𝐹𝑖𝑑− | −0.0588 | 0.0588 | −0.0294 | 0.0294 |
Table 7. The results of explanations on Tree-Cycles dataset: 𝐴𝐶(↑), 𝐹𝑖𝑑+(↑), 𝐹𝑖𝑑−(↓). The presented outcomes encompass averages from five runs. Note that the best-performing results have been emphasised in bold. In this table, “Our Method” refers to our proposed method ACGAN-GNNExplainer.
K | Metrics | Our Method | OrphicX | Gem | GNNExplainer |
6 | 𝐴𝑐𝑐𝑒𝑥𝑝 | 0.9714 | 0.9714 | 0.7143 | 0.1714 |
𝐹𝑖𝑑+ | 0.9714 | 0.9429 | 0.9714 | 0.9143 | |
𝐹𝑖𝑑− | 0.0000 | 0.0000 | 0.2571 | 0.8000 | |
7 | 𝐴𝑐𝑐𝑒𝑥𝑝 | 1.0000 | 0.9714 | 0.8286 | 0.5143 |
𝐹𝑖𝑑+ | 0.9714 | 0.9429 | 0.9714 | 0.9429 | |
𝐹𝑖𝑑− | 0.0286 | 0.0000 | 0.1429 | 0.4571 | |
8 | 𝐴𝑐𝑐𝑒𝑥𝑝 | 0.9429 | 1.0000 | 0.7143 | 0.8000 |
𝐹𝑖𝑑+ | 0.9714 | 0.9429 | 0.9714 | 0.9714 | |
𝐹𝑖𝑑− | 0.0286 | 0.0286 | 0.2571 | 0.1714 | |
9 | 𝐴𝑐𝑐𝑒𝑥𝑝 | 0.9143 | 1.0000 | 0.8571 | 0.9143 |
𝐹𝑖𝑑+ | 0.9714 | 0.9429 | 0.9714 | 0.9714 | |
𝐹𝑖𝑑− | 0.0571 | 0.0286 | 0.1143 | 0.0571 | |
10 | 𝐴𝑐𝑐𝑒𝑥𝑝 | 0.9714 | 1.0000 | 0.8857 | 0.9143 |
𝐹𝑖𝑑+ | 0.9714 | 0.9429 | 0.9714 | 0.9714 | |
𝐹𝑖𝑑− | 0.0000 | 0.0286 | 0.0857 | 0.0571 |
As indicated in Table 6, no singular model consistently outperforms the remaining baselines across every metric on the BA-Shapes dataset. Nonetheless, as the values of K increase, ACGAN-GNNExplainer displays a steady enhancement in explanation accuracy (𝐴𝐶𝐶𝑒𝑥𝑝) along with improved optimization in terms of Fidelity-. Alternatively, OrphicX maintains superior Fidelity+ metrics across multiple settings of K, demonstrating its capability to isolate necessary subgraphs. However, its lower efficiency in 𝐴𝐶𝐶𝑒𝑥𝑝 and Fidelity- indicates that it encounters difficulties in producing complete and accurate explanation subgraphs.
The metrics listed in Table 7 demonstrate that all evaluated approaches show comparable efficiency on the Tree-Cycles dataset across different K choices. However, mirroring the experimental patterns documented for the BA-Shapes dataset (Table 6), no individual framework comprehensively beats all others across every assessment parameter. Remarkably, within the range where K={6,7}, our approach (ACGAN-GNNExplainer) emerges as the most proficient framework, delivering the highest fidelity marks across all K conditions; meanwhile, though OrphicX surpasses ACGAN-GNNExplainer regarding Fidelity- and explanation accuracy (𝐴𝐶𝐶𝑒𝑥𝑝) when K scales between {8,9,10}, ACGAN-GNNExplainer maintains a highly stable and robust performance level.
On the whole, all GNN explanation tools perform capably on synthetic data, a trend largely driven by the uncomplicated structural nature of these graphs relative to authentic environments. Importantly, ACGAN-GNNExplainer regularly demonstrates superior performance across numerous test configurations. Even in scenarios where it does not outright lead its rivals, ACGAN-GNNExplainer maintains a highly competitive standing. To offer a more exhaustive validation, we expand our empirical investigation to authentic data domains for an in-depth analysis.
To secure further verification of our approach, we executed additional tests on two standard real-world graph benchmarks: Mutagenicity [33] and NCI1 [34]. The outcomes of these trials are documented in Table 8 for the Mutagenicity benchmark and Table 9 for the NCI1 benchmark.
Table 8. The results of explanations on Mutagenicity dataset: 𝐴𝐶(↑), 𝐹𝑖𝑑+(↑), 𝐹𝑖𝑑−(↓). The presented outcomes encompass averages from five runs alongside their corresponding standard deviations. Note that the best-performing results have been emphasised in bold. In this table, “Our Method” refers to our proposed method ACGAN-GNNExplainer.
R | Metrics | Our Method | OrphicX | Gem | GNNExplainer |
0.5 | 𝐴𝑐𝑐𝑒𝑥𝑝 | 0.6175 | 0.4539 | 0.5737 | 0.6175 |
𝐹𝑖𝑑+ | 0.3963 | 0.2419 | 0.3018 | 0.3618 | |
𝐹𝑖𝑑− | 0.2535 | 0.4171 | 0.2972 | 0.2535 | |
0.6 | 𝐴𝑐𝑐𝑒𝑥𝑝 | 0.6037 | 0.5599 | 0.6014 | 0.5968 |
𝐹𝑖𝑑+ | 0.3828 | 0.2949 | 0.3295 | 0.3825 | |
𝐹𝑖𝑑− | 0.2673 | 0.3111 | 0.2696 | 0.2742 | |
0.7 | 𝐴𝑐𝑐𝑒𝑥𝑝 | 0.7074 | 0.6244 | 0.659 | 0.6313 |
𝐹𝑖𝑑+ | 0.3986 | 0.2995 | 0.2857 | 0.3963 | |
𝐹𝑖𝑑− | 0.1636 | 0.2465 | 0.212 | 0.2396 | |
0.8 | 𝐴𝑐𝑐𝑒𝑥𝑝 | 0.7673 | 0.7097 | 0.7235 | 0.6935 |
𝐹𝑖𝑑+ | 0.3602 | 0.3157 | 0.2581 | 0.3641 | |
𝐹𝑖𝑑− | 0.1037 | 0.1613 | 0.1475 | 0.1774 | |
0.9 | 𝐴𝑐𝑐𝑒𝑥𝑝 | 0.7903 | 0.8111 | 0.7903 | 0.7811 |
𝐹𝑖𝑑+ | 0.3871 | 0.2949 | 0.212 | 0.3641 | |
𝐹𝑖𝑑− | 0.0806 | 0.0599 | 0.0806 | 0.0899 |
Table 9. The results of explanations on NCI1 dataset: 𝐴𝐶(↑), 𝐹𝑖𝑑+(↑), 𝐹𝑖𝑑−(↓). The presented outcomes encompass averages from five runs alongside their corresponding standard deviations. Note that the best-performing results have been emphasised in bold. In this table, “Our Method” refers to our proposed method ACGAN-GNNExplainer.
R | Metrics | Our Method | OrphicX | Gem | GNNExplainer |
0.5 | 𝐴𝑐𝑐𝑒𝑥𝑝 | 0.6569 | 0.562 | 0.5645 | 0.5961 |
𝐹𝑖𝑑+ | 0.4015 | 0.3114 | 0.3796 | 0.3358 | |
𝐹𝑖𝑑− | 0.2141 | 0.309 | 0.3066 | 0.2749 | |
0.6 | 𝐴𝑐𝑐𝑒𝑥𝑝 | 0.6496 | 0.6496 | 0.6083 | 0.6107 |
𝐹𝑖𝑑+ | 0.4523 | 0.3431 | 0.4307 | 0.3625 | |
𝐹𝑖𝑑− | 0.2214 | 0.3236 | 0.2628 | 0.2603 | |
0.7 | 𝐴𝑐𝑐𝑒𝑥𝑝 | 0.6861 | 0.6083 | 0.6837 | 0.6788 |
𝐹𝑖𝑑+ | 0.4453 | 0.3382 | 0.4282 | 0.3844 | |
𝐹𝑖𝑑− | 0.1849 | 0.2628 | 0.1873 | 0.1922 | |
0.8 | 𝐴𝑐𝑐𝑒𝑥𝑝 | 0.7932 | 0.708 | 0.7518 | 0.7616 |
𝐹𝑖𝑑+ | 0.4672 | 0.3698 | 0.4404 | 0.3747 | |
𝐹𝑖𝑑− | 0.0779 | 0.163 | 0.1192 | 0.1095 | |
0.9 | 𝐴𝑐𝑐𝑒𝑥𝑝 | 0.8446 | 0.8102 | 0.8321 | 0.8127 |
𝐹𝑖𝑑+ | 0.3942 | 0.3139 | 0.3212 | 0.3236 | |
𝐹𝑖𝑑− | 0.0254 | 0.0608 | 0.0389 | 0.0584 |
As displayed in Table 8, ACGAN-GNNExplainer exhibits superior outcomes regarding both explanation accuracy (𝐴𝐶𝐶𝑒𝑥𝑝) and fidelity metrics across the majority of test configurations spanning R values from 0.5 to 0.8. While OrphicX reaches a marginally higher explanation accuracy (𝐴𝐶𝐶𝑒𝑥𝑝) at the specific point where R=0.9, its performance falls behind in fidelity parameters. In operational deployments of GNN explanation frameworks, keeping fidelity levels high without degrading classification accuracy is paramount, a factor that gives our framework a clear competitive edge. Correspondingly, Table 9 demonstrates that ACGAN-GNNExplainer reliably beats alternative frameworks in both fidelity and accuracy parameters across all varied configurations of R.
ACGAN-GNNExplainer reliably attains higher Fidelity+ scores, highlighting its capacity to preserve the most meaningful graph substructures. Furthermore, its lower Fidelity- records, compared to alternative architectures, demonstrate the high sufficiency of our generated explanations, capturing the critical signal needed for correct classifications while purging peripheral noise. Additionally, ACGAN-GNNExplainer steadily outperforms the other baselines in explanation accuracy, proving its proficiency in decoding the foundational logic governing the underlying GNN model's predictions. Ultimately, these experimental outcomes emphasize the value of ACGAN-GNNExplainer in producing highly faithful and dependable explanations.
Merits of our methods. Our proposed frameworks offer several crucial advantages:
They accurately capture underlying structural patterns within graphs, inherently delivering explanations at the intended scale.
Once the training phase is complete, they can synthesize explanations for unseen graphs without needing further training.
They reliably construct structurally valid and meaningful subgraphs, a process sustained by the continuous supervision of the discriminator.
They demonstrate robust capability across a variety of graph tasks, including node classification and graph classification.
Limitations of GAN-GNNExplainer. Despite the progress achieved by GAN-GNNExplainer in improving the interpretability of GNNs, a few constraints remain:
Impact of real-world dataset reliability on performance: Authentic graph benchmarks frequently suffer from confounding variables, such as noise embedded in node attributes and graph topologies. This consequently degrades the operational efficacy of GAN-GNNExplainer.
Lack of fidelity optimization: While fidelity is a vital property for generating faithful interpretations, the architectural objective of GAN-GNNExplainer centers on balancing accuracy with explainability, meaning fidelity is not directly optimized as a primary metric.
These challenges can be alleviated by integrating a more sophisticated discriminator to safeguard reliability and incorporating a fidelity-focused loss function during optimization. In our subsequent ACGAN-GNNExplainer framework, we have successfully addressed these constraints.
Future work. Although ACGAN-GNNExplainer has resolved some of these drawbacks and demonstrated highly competitive outcomes regarding both accuracy and fidelity, there are still avenues that require further optimization:
Preprocessing overhead: The preliminary phase dedicated to extracting ground-truth explanations for the training data introduces considerable computational demands and time overhead.
Substantial data requirements: The framework depends on an extensive collection of training graphs to ensure effective optimization and performance.
Resolving these limitations will further advance the operational capacity and generalization of ACGAN-GNNExplainer, fostering more robust and equitable interpretability frameworks for graph-based architectures in diverse fields. Future investigations should focus on optimizing the framework design to minimize dependency on ground-truth data, thereby simplifying the data preparation phase and boosting overall efficiency. Additionally, investigating methods for strategic data augmentation or semi-supervised learning could help reduce the demand for large-scale training collections.
Demystifying the internal operations of GNNs is vital for increasing user confidence in their outputs, verifying their dependability in practical deployments, and promoting the engineering of trustworthy GNN frameworks. To meet these objectives, a diverse array of interpretive frameworks has been introduced recently. While these methods demonstrate remarkable proficiency in specific dimensions, many struggle to maintain strong performance when applied to real-world datasets.
To overcome this bottleneck, we introduce two distinct methodologies in this paper. First, we propose an original interpretation framework named GAN-GNNExplainer for GNN models. This architecture leverages a generator to construct explanations alongside a discriminator that guides the synthesis process, ensuring the structural validity of the outputs. Nevertheless, GAN-GNNExplainer exhibits limitations in generating highly faithful explanations and shows suboptimal performance on complex, real-world data distributions.
To address the shortcomings of GAN-GNNExplainer, we introduce ACGAN-GNNExplainer, an advanced explanation framework for GNN models. While this model also utilizes a generator to assemble explanations, it employs an enhanced discriminator that continually guides the synthesis process, resulting in explanations that are both structurally valid and highly faithful.
To validate the efficacy of our proposed frameworks, we perform exhaustive empirical evaluations on both synthetic and real-world graph benchmarks. We benchmark the accuracy and fidelity metrics of our methods against leading GNN explanation baselines. The experimental findings convincingly show that ACGAN-GNNExplainer excels at delivering high-fidelity and accurate explanations, particularly when deployed on real-world datasets.
None
None
None
None
Open Access The author(s) retain copyright. This article is licensed under the Creative Commons Attribution-NonCommercial-ShareAlike 4.0 International License. It may be shared and adapted for non-commercial purposes with appropriate attribution, an indication of changes, and distribution of adaptations under the same license. Third-party material may be subject to separate terms identified in its credit line. View the license at https://creativecommons.org/licenses/by-nc-sa/4.0/.
 Transparent Intelligence Publishing