The printed circuit board (PCB) serves as a fundamental component across all electronic devices, and the assurance of its fabrication quality exerts a major influence on the final pricing of the product. Consequently, research and development (R&D) focused on optimizing inspection techniques has emerged as a expanding area of global interest. Among the various paradigms utilized for PCB evaluation, visual analysis constitutes the preponderance of contemporary methodologies. To that end, this survey aggregates the most influential investigations conducted over the past quarter-century, outlining their operational frameworks and historical progression up to the present day, with a particular emphasis on the integration of artificial intelligence (AI) methodologies to enhance functional efficacy and minimize operational expenditures. Additionally, this study underscores the vital role that open-access PCB datasets play in facilitating the advancement of these techniques and establishing baseline metrics for benchmarking. Lastly, the current difficulties and obstacles confronting the discipline are delineated and analyzed.
The manufacturing of electronic components stands as one of the most prominent industrial sectors, characterized by pronounced exponential expansion. In the year 2021, the valuation of global electronics manufacturing and design service contracts reached approximately USD481.3 billion, exhibiting an annual growth rate of 10.5%, with projections indicating a market volume of roughly USD1158.6 billion by 2030 [1].
Although China commands the largest market share in electronics assembly, international trends point toward a broader geographic dispersion of manufacturing facilities across the globe. This shift intensifies competitive rivalries for market dominance, thereby emphasizing the urgent necessity for the advancement of superior quality control frameworks [2]. At present, corporate research and development (R&D) funding is increasingly directed toward the implementation of sophisticated technologies, targeting not only the core fabrication processes but also the creation of more adaptable and automated quality assessment architectures. Within the context of technology optimization driven by the Industry 4.0 paradigm, these advanced frameworks are commonly referred to as Smart Manufacturing Systems (SMS) [3].
Contemporary efforts by electronics manufacturers to enhance production quality are focused on the engineering of high-precision inspection SMS. This alignment follows the modern "Zero Defects Manufacturing" (ZDM) philosophy, which seeks to incorporate organizational strategies aimed at minimizing manufacturing anomalies to the greatest extent possible [4]. Within the domain of the electronics industry, the foundational element of every electronic architecture is the printed circuit board (PCB). As a result, the PCB often represents the most susceptible component of the product, rendering it the primary focal point for the mitigation of fabrication faults [5-7].
As a mature and well-established engineering concept, PCB manufacturing is structurally bifurcated into two primary phases: the bare PCB (BPCB) and the PCB assembly (PCBA). The BPCB consists of the unpopulated, insulating base board featuring only the raw conductive pathways, holes, vias, and solder pads. Conversely, the PCBA signifies the subsequent assembly phase wherein electronic components (including resistors, capacitors, inductors, and integrated circuits) are metallurgically bonded to the board [6].
During the initial eras of manufacturing, PCB evaluation relied solely on human technicians utilizing manual visual assessments alongside basic electrical continuity tests. Nonetheless, this methodology quickly proved inadequate when confronted with accelerating production velocities, heightened precision tolerances, and micro-scale components, not to mention the taxing and fatiguing conditions imposed on human inspectors [6, 7]. Consequently, an array of diverse PCB evaluation strategies has emerged over time, encompassing automated optical inspection (AOI), X-ray radiography, laminography, ultrasonic testing, and thermographic imaging [8]. While each of these approaches enhanced inspection precision, the majority were quickly constrained by factors such as prohibitive equipment costs or extended cycle times. Thus, AOI established itself as the most practical methodology, given its capacity to identify nearly all categories of anomalies through an accelerated and entirely non-destructive process [6-8].
However, despite the widespread adoption of AOI systems within PCB inspection pipelines over the past thirty years, the technology remains highly capital-intensive and is primarily supplied by a restricted cluster of proprietary corporations. Consequently, mid-tier PCB producers frequently remain unable to transition away from manual human oversight [5, 9]. Recently, a significant portion of state-of-the-art (SOTA) research has leveraged contemporary breakthroughs in AI for computer vision tasks to augment the capabilities of AOI. Accordingly, R&D initiatives in recent years have concentrated on the engineering of more cost-efficient AOI solutions for PCB diagnosis [5-7, 10].
With the rise of machine learning, specifically concentrated on deep learning architectures, vision-based inspection frameworks have matured into premium, commercially viable technologies. Nevertheless, these systems are frequently cost-prohibitive regarding data compilation. Deep learning vision models typically require training repositories encompassing thousands of distinct images to ensure robust and viable deployment in production environments, a requirement that is not always financially practical. Furthermore, these architectures are generally vulnerable to concept drift—a critical challenge wherein the predictive accuracy of the AI model degrades due to natural variations over time within the data domain. This limitation necessitates the continued involvement of human operators, despite their constraints regarding inspection velocity and consistency. Even so, contemporary AI paradigms are yielding encouraging outcomes for high-velocity operations with acceptable levels of precision.
This literature review presents the most significant implementations of AOI frameworks for PCB quality assurance, charting major technical shifts over time while identifying the primary methodological pathways and hurdles in current SOTA research. Furthermore, this study seeks to elucidate contemporary AI implementations for PCB analysis, outlining both their practical utility and persistent constraints.
The methodology of PCB quality assessment can be categorized by the operational state of the board under review: the BPCB domain or the PCBA domain. An examination of historical literature concerning PCB anomaly analysis reveals a consistent topology of defect categories shared across virtually all classifications of boards. Within both domains, specific fault types exist that entirely compromise the operational utility of the circuit board. For BPCBs, these critical failures include unetched copper remnants, open circuits, short circuits, omitted drill holes, and incorrectly aligned holes; for PCBAs, they encompass missing, thermally damaged, or reversed components, alongside open solder joints. Even when certain anomalies do not completely neutralize the functionality of the circuit, they can induce electrical noise during operation and potentially provoke premature failure via accelerated physical degradation. Examples of these non-catastrophic faults include over-etched or under-etched copper lines, mouse bites, partial open circuits, spurious copper artifacts, incipient short circuits, particulate contamination, and trapped air pockets within BPCBs. Correspondingly, misaligned components, tombstoning, cold solder connections, partially burned components, and pre-damaged elements represent equivalent faults within the PCBA domain [5-8]. Figure 1 displays examples of flawed specimens for both a BPCB and a PCBA.
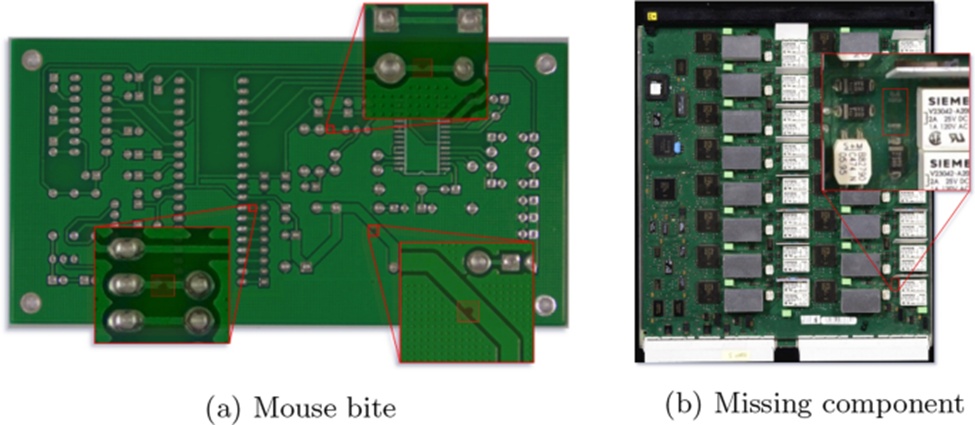
Figure 1. Defective samples of a BPCB and a PCBA. a A BPCB taken from a public PCB dataset by Ding et al. [11]. b A PCBA taken from dataset FICS-PCB by Lu et al. [12]
It is possible to categorize PCB diagnostic techniques into conventional methodologies that rely on computer-assisted tools, various auxiliary hardware components, or purely manual human execution. Conversely, blending these traditional methodologies with AI frameworks trained on specific reference datasets can substantially enhance the throughput and precision of diagnostic setups. Consequently, by mapping out the respective defect categories and potential procedural approaches, this literature review is organized according to the architecture outlined in Figure 2.
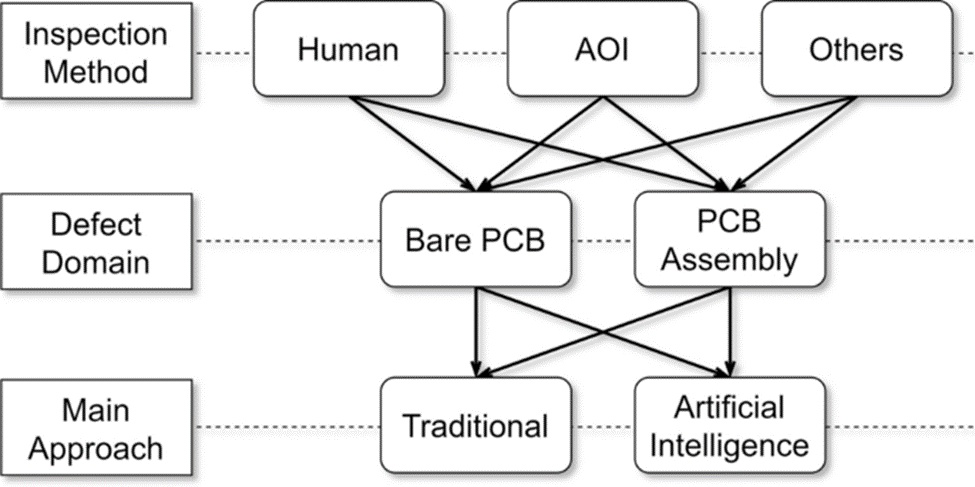
Figure 2. Survey structure of PCB inspection methods, domains, and approaches
The subsequent two segments outline the leading contemporary SOTA techniques for BPCB and PCBA analysis, respectively. Each segment is internally organized into two subsections: one focusing on traditional systems that omit AI methodologies, and another dedicated to AI-driven systems.
The following two subsections review the academic publications regarding Bare PCB evaluation compiled in this survey. Their syntheses are organized in a chronological sequence, tracing the trajectory from the recent past to the contemporary SOTA, in accordance with the timeline delineated in Figure 3.
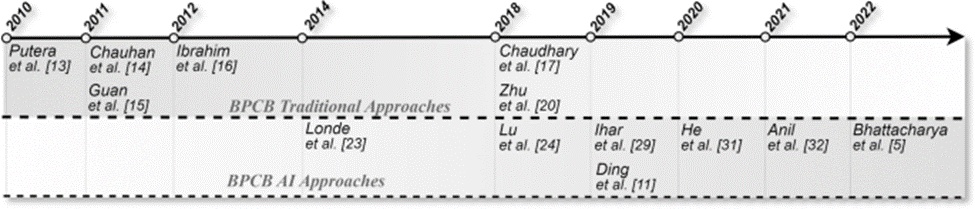
Figure 3. Timeline of Bare PCB inspection methods covered in the present survey
Putera and Ibrahim [13] merge two earlier methodologies to evaluate BPCB traces using morphological segmentation extraction predicated on a template-matching framework. This approach requires the test and template instances to be rigorously aligned with one another, meaning both graphical representations must share an identical relative spatial orientation. Subsequently, utilizing the MATLAB computational environment, each image is partitioned into four distinct morphological categories: square segments, hole segments, thick-line segments, and thin-line segments. The resulting graphical representations are converted into binary black-and-white formats so that each corresponding template and test segment can be coupled via an XOR logical operation. In this process, the variance between the pairs forms the sole remaining residue, which can be flagged as anomalies, as shown in Figure 4. The proposed methodology successfully identified 7 out of the 14 BPCB anomalies outlined in their research. Although the investigators indicate a high detection confidence rate, they emphasize certain conditions where the segmentation and binarization phases can introduce unwanted artifacts, thereby raising the probability of a missed detection.

Figure 4. Example of XOR operation between template and test sample, by Putera and Ibrahim [13]
Adhering to the template-matching paradigm, Chauhan and Bhardwaj [14] likewise introduce an image differentiation methodology leveraging an XOR logical operation. However, rather than partitioning the image into morphological zones as seen in the aforementioned technique, they supply a geometric statistical evaluation of the resultant XOR products. This analysis reveals recurrent configurations stemming from potential BPCB faults, which serve as critical features for subsequent deterministic image classification frameworks. The researchers also highlight that the efficacy of the XOR operation methodology can be constrained by the alignment precision of the images required to achieve meaningful outcomes.
Guan and Guo [15] propose an algorithmic mathematical technique designed to enhance a BPCB image as a preprocessing step for fault diagnosis. The investigators exploit the high-contrast characteristics of BPCB photographs between the conductive paths and the non-conductive substrate to derive what they designate as a double sigmoid operation, which is capable of improving image sharpness while filtering out noise. In brief, the double sigmoid mechanism involves a derivative sigmoid operation executed on grayscale images to mitigate the typical edge-blurring effect found in photography, followed by a post-integrative step to reconstruct the primary image. The authors assert that the primary benefit of their approach over conventional noise-reduction filters is that the latter typically introduce unwanted edge smoothness, whereas their technique simultaneously eliminates noise and sharpens image boundaries. Figure 5 illustrates an example of their outcomes.
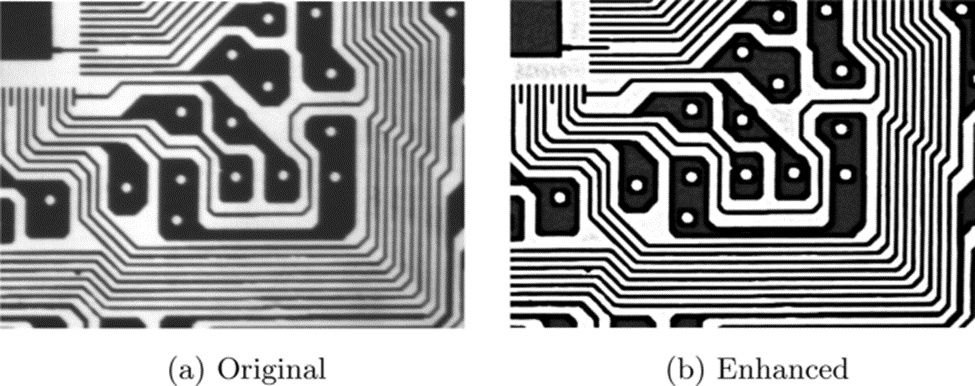
Figure 5. Comparison between original and enhanced images, by Guan and Guo [15]
Seeking to optimize the XOR template-matching pipeline, Ibrahim et al. [16] present a multi-stage image processing algorithm that incorporates the XOR operation and terminates with a series of specialized sub-algorithms tailored for each distinct fault category. The system is designed to identify seven fault classifications: missing holes, incorrect sizing, open circuits, short circuits, pinholes, under-etching, and mouse bites. A key novelty introduced by the investigators was the alignment algorithm, which combines geometric transformations to precisely orient the test image relative to the reference template. The researchers document a mean calculation time of roughly 20 s for graphics with a resolution of 1580x917 pixels using the MATLAB software suite. This duration may pose an industrial constraint depending on throughput demands, though it remains more rapid than manual human inspection.
Chaudhary [17] introduces an innovative automated BPCB diagnostic architecture asserted to be rapid enough for real-time manufacturing environments. This framework employs FAST as an image feature extraction algorithm [18] and MSAC for image registration [19], executed on grayscale image pairs consisting of a template and a test sample. Furthermore, mirroring the strategies of Putera and Ibrahim et al. [13, 16], this methodology uses image segmentation to isolate what the investigator defines as the three primary components of a BPCB: conductive traces, solder pads, and drill holes. The segmentation is achieved via normalized histogram thresholding derived from the binarized image, as illustrated in Figure 6. From this histogram, it is possible to extract the binarization thresholds needed to isolate the substrate background, the conductive tracks, and the solder pads, while the holes can be segmented independently from the pads. Following segmentation, the template-test image pair undergoes subtraction in line with earlier studies [13, 16], generating a set of positive and negative residual images. Depending on the specific fault class, each resultant image serves as the dataset input for fault detection and classification algorithms. The researcher introduces a discrete image processing algorithm based on geometric evaluation for each of the 14 most prevalent BPCB defect configurations, reporting successful detection and categorization. Additionally, a processing duration of approximately 2.53 s is claimed, which could facilitate a real-time AOI framework.
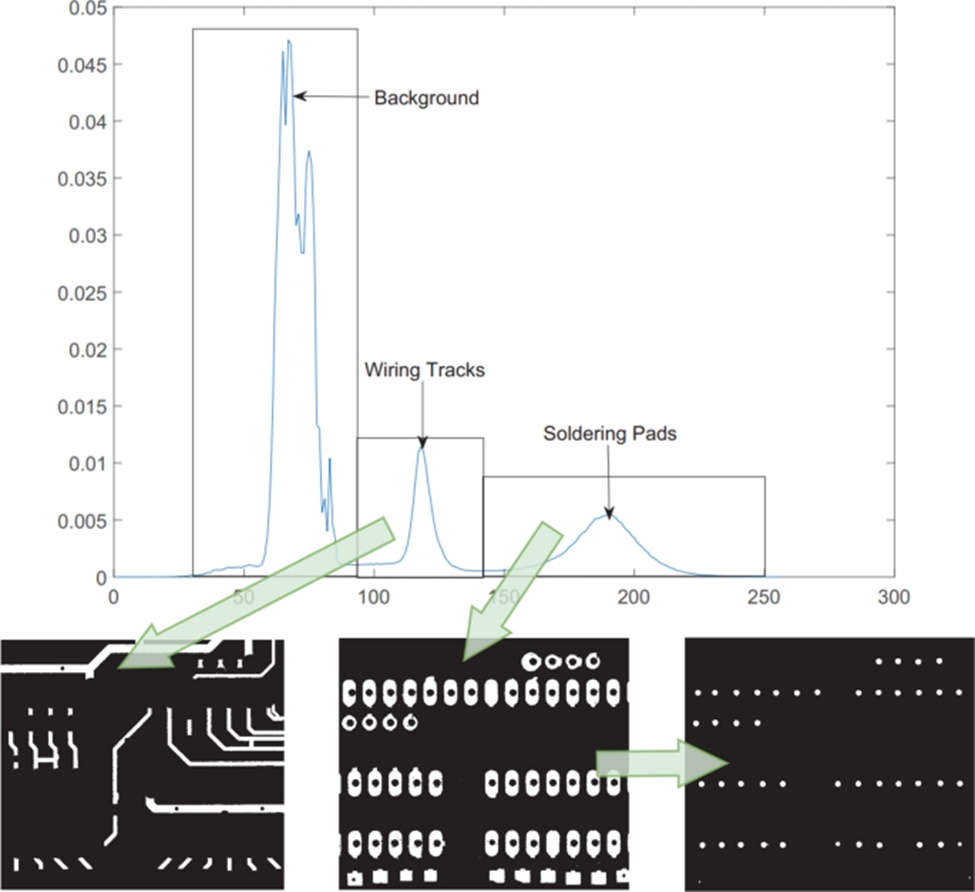
Figure 6. Normalized histogram for image segmentation, by Chaudhary et al. [17]
Zhu et al. [20] address the analysis of five BPCB fault types utilizing a template-matching methodology. The primary divergence from earlier techniques lies in the application of Discrete Wavelet Denoising for image quality enhancement [21] and the Hough Transform as a feature extraction tool for image registration [22]. Their approach for identifying and categorizing defects aligns with previous literature, utilizing image subtraction for localization and geometric analysis algorithms for classification. Utilizing a dataset containing 30 defective PCB images, the researchers claim a 100% detection rate alongside a 90% accuracy rate in classification. Figure 7 demonstrates an instance of defect identification from their study.
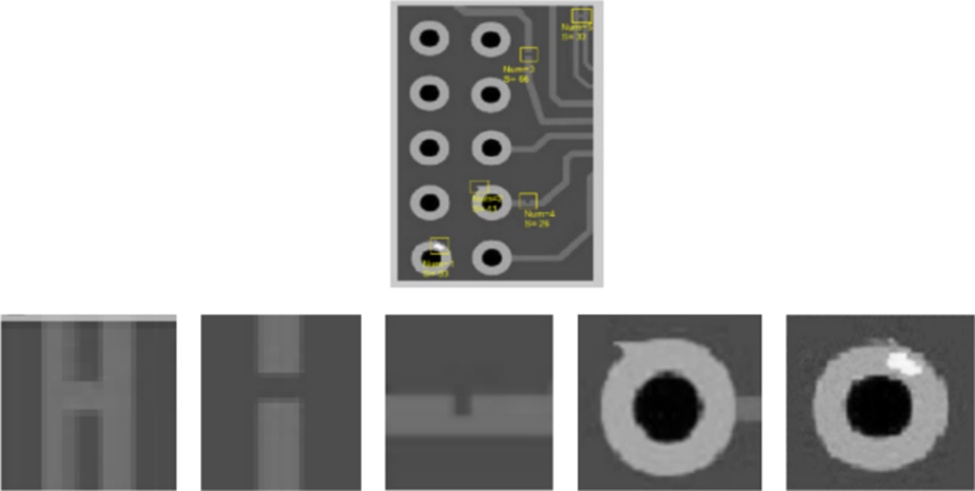
Figure 7. Example of 5 defects detection in BPCB, by Zhu et al. [20]
Arguably one of the earliest deployments of machine learning frameworks to enhance PCB AOI setups was presented by Londe and Chavan [23]. Their system utilizes the MATLAB Image Processing Toolbox to execute a template-matching difference calculation between paired images, subsequently processing the results to isolate discriminative features for classifying all 14 recognized BPCB anomalies. The ML model employed is K-Nearest Neighbors (KNN), a non-parametric technique used to cluster the feature data; that is, it determines the feature distances across all specimens in the dataset and groups them into $K$ clusters, which are established beforehand by the system designer. For instance, within a 14-defect classification framework, the KNN model can be configured with $K = 15$, where one specific category represents a "defect-free" state. The investigators report a mean accuracy of 75.37% across all 14 defect categories, though the total volume of evaluated images and defect counts are not specified.
Employing a supervised machine learning (ML) classification framework, Lu et al. [24] propose an architectural blend of deterministic image processing workflows and support vector machines (SVM) for the ML model. The image preprocessing phase begins with binarization followed by noise reduction using median and mean filters. Subsequently, two feature extraction pipelines utilizing LBP and HOG algorithms perform dimensionality reduction and data filtering [25, 26]. The two resulting feature matrices are integrated via Bayes Fusion prior to an SVM training phase [27]. Evaluated on 184 training images and 108 test images, the dataset consists of positive and negative pairs, and the authors report a defect detection precision of 89.22%.
Ding et al. [11] observe that BPCB defects are generally composed of a very small number of pixels, rendering them minuscule in comparison to the comprehensive high-resolution images captured from PCBs. These highly localized dimensions pose a major difficulty for conventional convolutional neural network (CNN) models, where microscopic image features are prone to vanishing within the deeper layers of the network. To mitigate this challenge, they introduce a pyramidal concatenation method, shown in Figure 8, inspired by the ResNet architecture of He et al. [28]. This technique captures data from the preceding layers of the CNN and forwards it into the deeper zones of the model, thereby maintaining small-scale feature data. The approach was validated on the public dataset from Huang et al. [10], achieving a 98.9% mAP score.
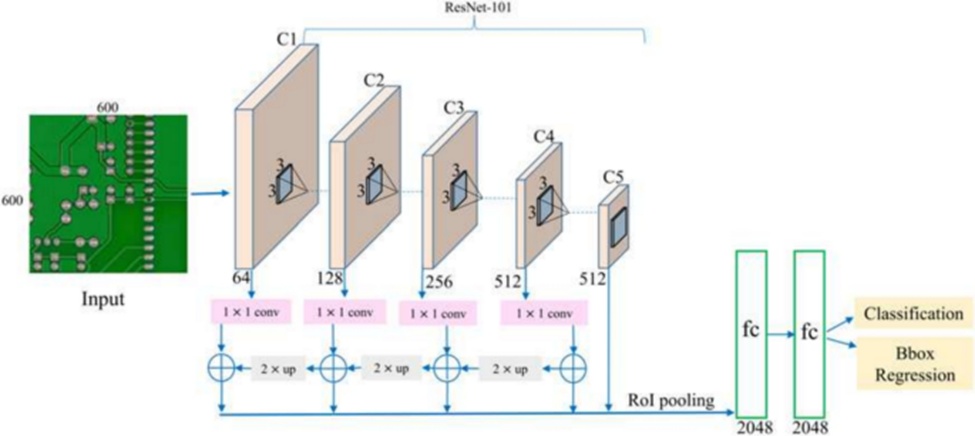
Figure 8. Pyramidal residual connections model architecture, by Ding et al. [11]
Ihar et al. [29] demonstrate the adaptation of an unsupervised deep learning framework into a self-supervised methodology for BPCB assessment. The researchers emphasize the typical scarcity of anomalous PCB training samples within manufacturing environments, which presents a major bottleneck for supervised machine learning pipelines. To circumvent this issue, they outline how a self-supervised architecture can acquire robust representations from a dataset primarily consisting of defect-free specimens alongside a minimal number of flawed instances. In their evaluation, they utilized a pre-trained VGG16 network established by Simonyan and Zisserman [30], fine-tuning the model on PCB data using self-supervised objectives to group the data into two primary clusters representing regular and anomalous samples. The authors documented an average defect detection accuracy of 80%, with specific anomaly categories exceeding 95%, despite training the system on a highly constrained set of defective samples—a feature they note is critical for industrial viability.
Mirroring the objective of the aforementioned study, He et al. [31] employ the VGG16 architecture within a self-supervised framework to address the insufficient quantity of representative defective instances. The primary differentiator in this research is the integration of the conventional template-matching image subtraction technique. However, rather than extracting image-pair characteristics through deterministic algorithms, they use a VGG16-lite backbone to derive these representations in a self-supervised manner, allowing the model to establish a more effective data representation map. Following feature extraction, a subtraction operation is performed on the data matrices. The residual feature set is subsequently processed by an additional custom deep learning network tasked with detecting and categorizing six prevalent BPCB anomalies, yielding three outputs correlated with the dimensions of the defect bounding boxes. Figure 9 depicts the structural design of their model along with its inputs and outputs. Utilizing a dataset of 2000 training and 1000 testing specimens, the researchers report a classification accuracy of 98.6%.
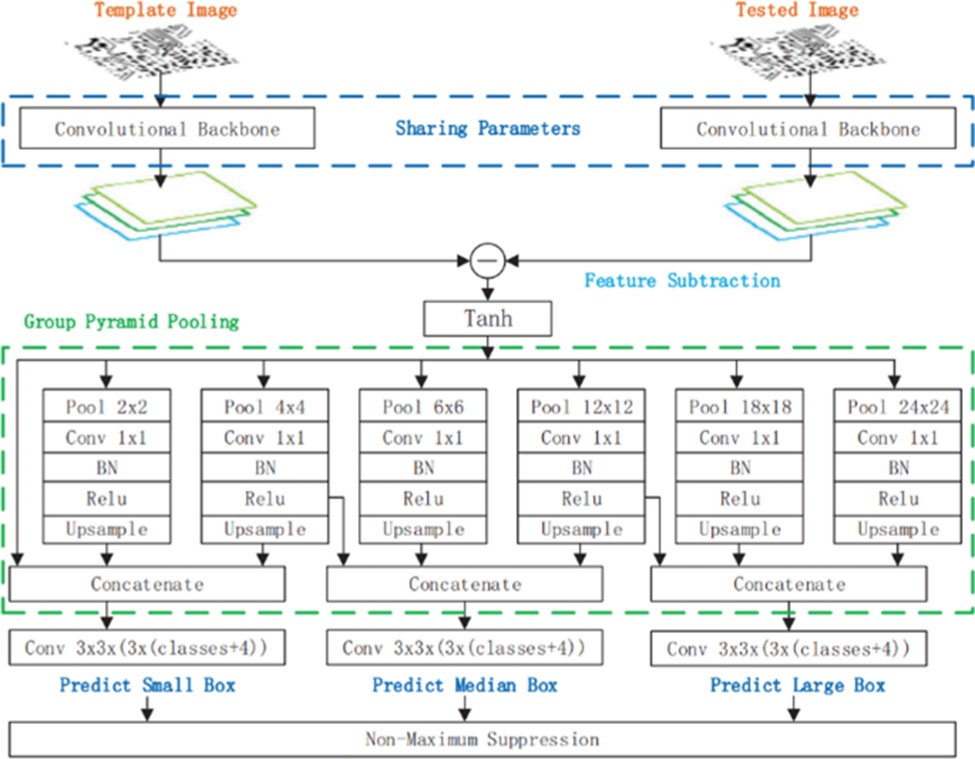
Figure 9. Model architecture, inputs and outputs, by He et al. [31]
In the work of Adibhatla et al. [32], the prominent SOTA deep learning model designated as YOLOv5 [33] is applied to an object detection and classification pipeline using a supervised approach. The investigators detail a dataset consisting of 23,000 PCB instances partitioned into compact patches to better represent minuscule faults relative to the entire dimensions of the board. This data repository was segmented into nine sections for training and one for testing, paired with a 10-fold cross-validation methodology. The YOLO architecture is optimized to localize defective regions within a rectangular bounding box while assigning a class confidence metric. In this implementation, the network is not trained to differentiate between discrete categories of defects, but rather groups all anomalies into a single overarching defect class. The authors state that this configuration enhances the overall detection performance of the system, despite omitting real-time fault classification, which could be handled by a secondary downstream task. The researchers document a peak mean accuracy of 99.74% alongside a false positive rate of 0.23%. Figure 10 displays examples of true positive localized small BPCB defects from their study.
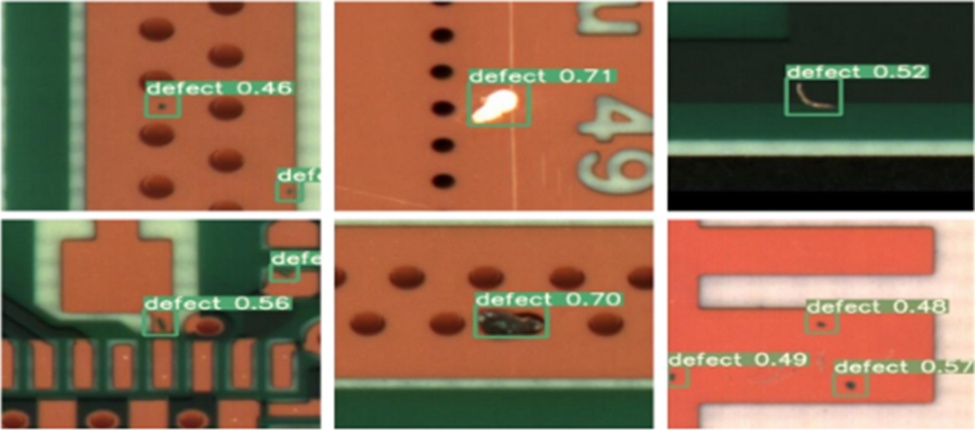
Figure 10. Sample images of BPCB defect detection, from Adibhatla et al. [32]
Bhattacharya and Cloutier [5] introduce a methodology similar to the previous study, utilizing the YOLOv5 framework for anomaly localization. Distinctively, they modify the foundational YOLOv5 architecture with a proprietary topology that they assert is more data-efficient while retaining the capacity to categorize each individual defect class. For their empirical evaluation, they used a dataset containing only 1,386 images across six BPCB defect classes sourced from Huang et al. [10]. Additionally, they present a data synthesis technique designed to provide greater data diversity in low-sample manufacturing contexts. The authors report a mean accuracy of 98.3% and a false positive rate below 5%, noting that their framework outperformed existing SOTA PCB evaluation methods when benchmarked under identical data constraints.
The subsequent two sections summarize the research papers focusing on PCB assembly diagnostic methodologies reviewed in this study. Their chronological progression is illustrated in Figure 11.
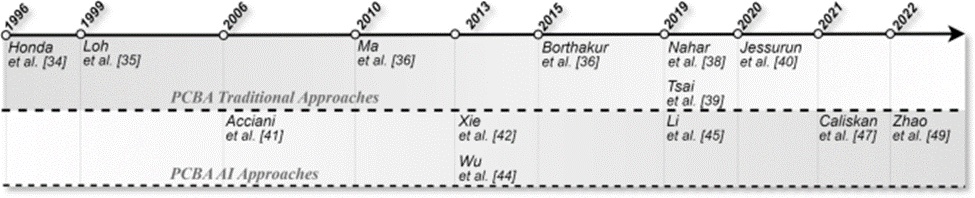
Figure 11. Timeline of PCB assembly inspection methods covered in the present survey
In the 1990s, Honda et al. [34] and Loh [35] contributed to the early development of modern PCBA AOI systems, though contemporary computational hardware constraints significantly hindered the engineering of high-efficiency systems. Both studies relied on human-operated visual inspection equipment, where technicians captured images of localized regions of interest for subsequent analysis via digital image processing techniques to identify solder joint anomalies. Their main objective centered on assessing component solder quality through deterministic algorithms combined with computer-assisted human visual review.
In 2010, Ma et al. [36] noted that the visual evaluation of solder joints still required substantial refinement regarding both inspection frameworks and standardized metrics. They presented a machine vision framework designed to augment the image acquisition quality of minute solder joints on PCBA elements, which included a proprietary illumination configuration to maximize image fidelity. Furthermore, they introduced a mathematical processing algorithm to evaluate the solder joint images, intended to serve as a feature extraction framework for future diagnostic research.
In the study by Borthakur et al. [37], a PCBA inspection framework inspired by earlier BPCB methodologies is proposed. Similar to the approach of Guan and Guo [15], this research employs a wavelet transform to enhance image processing fidelity. Following several preprocessing operations involving orientation alignment and feature extraction, image subtraction is executed. This subtraction step is designed to generate a high-contrast boundary wherever a component variance occurs between the template and test images. The investigators report an average classification accuracy of 82.5% across five distinct PCB typologies.
In a manner similar to Ibrahim et al. [16], Nahar and Phadke [38] utilize the MATLAB image processing toolbox to extract PCBA features and subtract the reference template image from the test instance. They leverage the positive and negative residual features and implement deterministic geometric algorithms to locate object centroids, thereby determining whether they indicate a defect. Prior to the subtraction phase, both feature sets must share an identical orientation, requiring image registration. Evaluated on 103 PCBA samples containing a aggregate total of 134 individual anomalies, the researchers report a detection accuracy of 91.1% without discrete defect classification.
Tsai and Huang [39] propose a significant strategic pivot for PCB diagnostic systems. While maintaining a template-matching methodology, they first apply a Fourier transform to both images, shifting the data analysis from the spatial domain into the frequency domain. The authors state that this configuration renders the process insensitive to image noise and translational shifts while maintaining the foundational frequency characteristics of the image. Consequently, image subtraction performed within the frequency domain yields a more robust operation for highlighting structural defects. Figure 12 displays application instances for both BPCB and PCBA anomaly detection. A key constraint outlined in their research relates to image resolution and information density, as the method exhibits reduced efficacy when applied to full-scale PCB images. To mitigate this bottleneck, the researchers implement a patch-wise division across the images to isolate smaller segments, which successfully resolved the limitation and yielded representative outcomes.
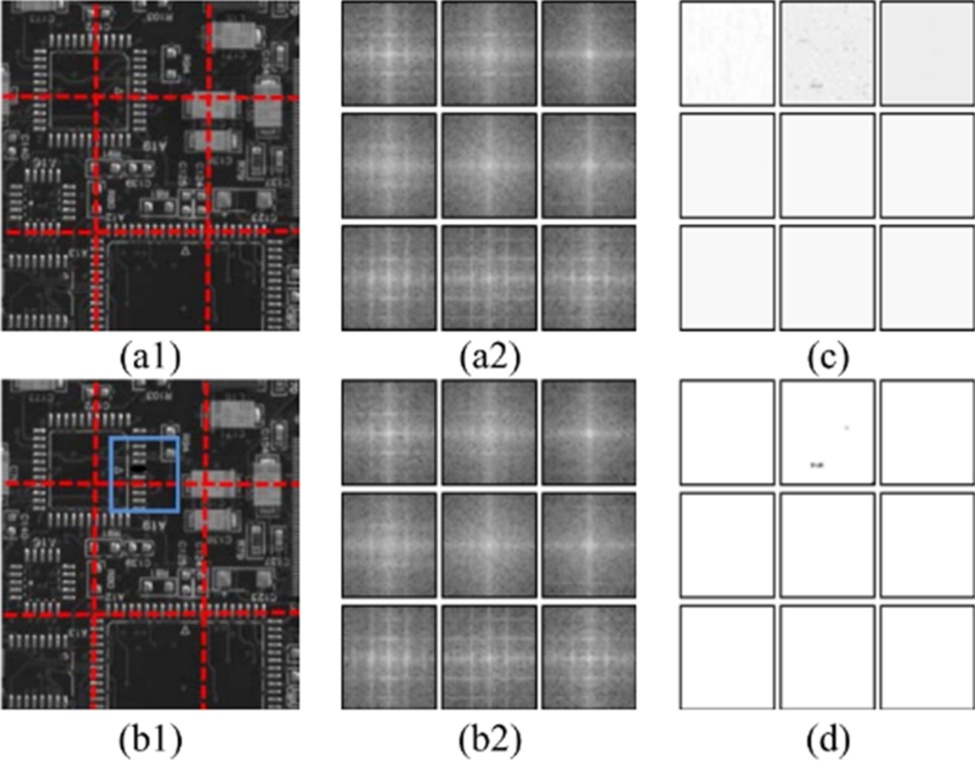
Figure 12. Example of a solder joint defect detection using smaller image patches. a1 and b1 template and test partitioned images, respectively; a2 and b2 respective frequency domain images; c subtracted and reconstruced images in spacial domain, and d thresholded image
Jessurun et al. [40] attempt to address PCBA component localization using an unconventional technique, introducing an algorithmic framework they designate as shadow detection enhancement (SHADE). Their methodology uses multiple PCB photographs captured under varying illumination angles to project distinct shadows across the board components. These images are integrated via MATLAB software by subtracting the repetitive component profiles observed under different lighting angles to generate a baseline template shadow. When this technique is applied to an anomalous test specimen, a distinct variant shadow is expected to emerge. The researchers conclude that while their SHADE technique enhances localized image features, it does not surpass existing SOTA inspection frameworks. Nonetheless, they suggest it could serve as a complementary feature extraction tool to support more robust diagnostic architectures.
Acciani et al. [41] underscore the significance of evaluating PCB solder joint integrity and present an initiative to integrate computer vision diagnostics with artificial neural networks. The initial phase involves the extraction and segmentation of regions of interest enclosing the solder joints on a broad scale. The applied AI architecture consists of a supervised multi-layer perceptron (MLP), which is trained using binary sets of positive and negative solder joint images. Furthermore, the investigators implement wavelet transformations and geometric feature extraction algorithms to generate input vectors for the MLP, thereby maximizing its discriminative potential. Although the scale of the training repository is not explicitly defined in the empirical documentation, the authors report a 10-fold cross-validation assessment yielding a 98.8% accuracy rate across five distinct solder joint structural states.
Xie et al. [42] detail one of the earliest deployments of genetic programming (GP) within the domain of PCB inspection. While maintaining the foundational paradigms of image registration and template subtraction, this study introduces a sliding window mechanism to gather a higher volume of data samples with minimized mutual information from the full PCB area. Each individual sliding window is pre-labeled as either positive or negative depending on its defect state to construct the training data. These localized windows are derived via the image subtraction pipeline and processed by the genetic algorithm, which attempts to learn the discriminative feature representations separating defective states from nominal states. The researchers argue that this methodology provides enhanced robustness over legacy template-matching techniques; the GP framework is capable of absorbing minor, acceptable variations inherent to industrial mass production without triggering the elevated false-positive rates typical of conventional algorithms. They record a false positive rate of 84.75%, which appears high relative to modern SOTA baselines. Nevertheless, the investigators defend these outcomes by asserting that the GP framework exhibits insensitivity to shifts in the PCB data domain. This critical vulnerability was subsequently formalized within the wider machine learning community as "concept drift" [43], marking this study as a notable conceptual forerunner to contemporary adaptive systems.
In a manner similar to the aforementioned research, Wu et al. [44] exploit a genetic algorithm but direct its application toward PCBA solder joint quality assessment. The objective of the investigators is to alleviate the operator fatigue associated with conventional AOI solder inspection workflows by codifying expert human knowledge of solder quality into a digital matrix of 14 deterministic classification features. They employ an MLP network to differentiate between six primary industrial solder joint classes; however, they note that the standalone MLP is highly susceptible to overfitting. To mitigate this limitation and enhance the generalization properties of the MLP, they introduce a GP technique to filter and select the most robust input features. Evaluated on a sample size of 195 solder joints, they document a 98.46% true positive rate, outperforming legacy machine learning frameworks tested on the identical data baseline.
Li et al. [45] document a comprehensive series of large-scale experiments focused on PCB component localization. They adopt the YOLOv3 network topology [46] as their baseline deep learning object detection framework, as illustrated in Figure 13. Rather than constructing an end-to-end defect inspection platform, the researchers concentrate on an upstream diagnostic phase: the raw component localization task. The primary goal is to train the deep learning model to resolve the exact spatial coordinates of every individual PCBA component. Figure 14 illustrates an operational output from this study. The engineered model successfully categorizes an extensive matrix of 29 discrete PCB component classifications with an mAP score of 93.07%, achieving 100% precision across 14 of those categories. To realize these substantial metrics, the investigators implemented several critical technical interventions, ranging from significant structural modifications of the standard YOLOv3 layer stack to a thorough data augmentation regimen. This workflow even integrated virtual PCBAs synthesized via Altium Designer PCB software, culminating in a hybrid dataset encompassing 50 distinct PCBA layouts containing a total of 182,900 components. Despite the heightened architectural complexity, the authors assert that their system represents a highly reliable instrument for augmenting industrial AOI hardware and enabling automated PCBA component extraction to support advanced defect analysis.
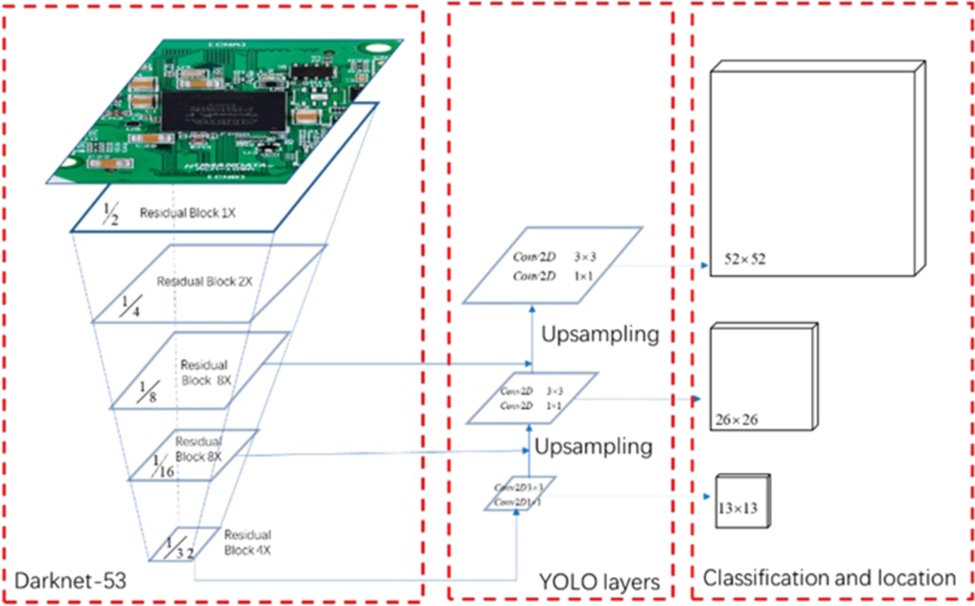
Figure 13. YOLOv3 model architecture, used by Li et al. [45]
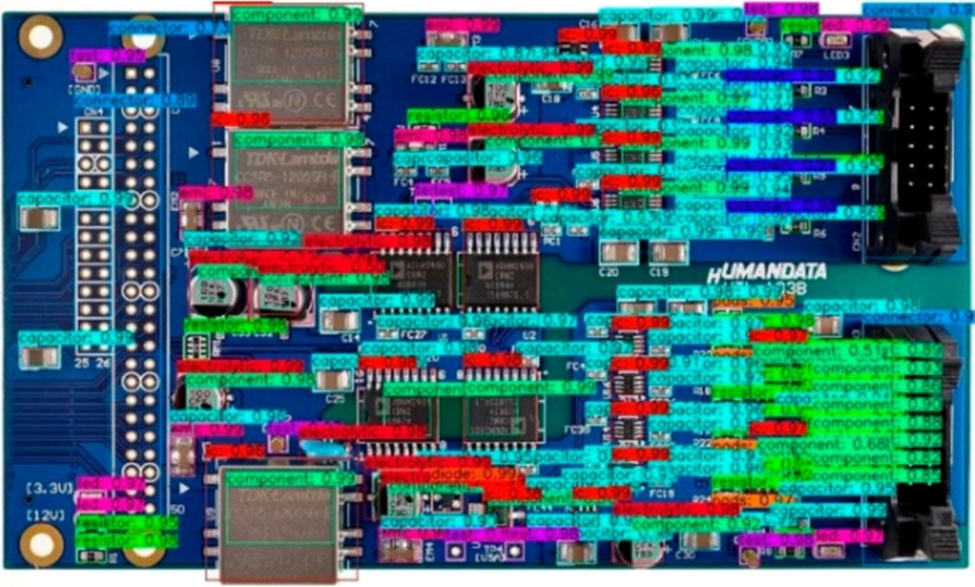
Figure 14. Improved YOLOv3 detection output example, by Li et al. [45]
Building upon the sustained SOTA performance of the YOLO architecture family, Caliskan and Gurkan [47] introduce an evaluation methodology utilizing the subsequent iteration of the framework, the YOLOv4 object detector [48], to localize and categorize solder joint anomalies on PCBAs. The network was trained using a repository of 40,000 image samples collected directly from an active production line, with manual annotations mapping out more than 70,000 discrete solder joint defects. The investigators emphasize that the model exhibits structural invariance to spatial orientation, effectively rendering legacy image registration algorithms obsolete. Furthermore, they highlight the model's resilience when deployed against highly divergent PCBA designs missing from the training baseline. The empirical evaluation documents a recall score of 97% alongside a precision score of 82%.
A recent investigation by Zhao et al. [49] introduces an innovative perspective regarding high-precision PCB inspection architectures. The publication highlights that contemporary SOTA frameworks achieve high diagnostic accuracy at the cost of massive data reliance or highly complex deep learning engineering. This resource intensity poses a significant hurdle when adapting models to industrial settings where the underlying data domain undergoes continuous evolution due to rapid technological and design iterations—i.e., the phenomenon of concept drift. To bypass this bottleneck, the researchers propose a hybrid methodology that pairs robust, deterministic image processing operations for primary feature extraction with less computationally demanding machine learning classifiers. While these simpler models may exhibit lower peak performance metrics compared to deep learning detectors like the YOLO series, they offer superior data adaptability and efficiency. Because they do not require tens of thousands of training instances, this approach represents a more pragmatic solution for manufacturing environments subject to frequent product updates.
Despite China's dominant market share in global PCB fabrication, the prevailing inspection paradigm within these facilities remains the conventional manual visual method, which relies heavily on human inspectors assisted by optical magnification tools. The enduring prevalence of this approach is not accidental; rather, it is sustained by its low financial barrier to entry and operational flexibility. Manual inspection requires no preliminary software programming overhead or capital expenditure for specialized diagnostic machinery. However, these immediate financial benefits are offset by subjectivity in error assessment, extended cycle times, and mounting long-term labor costs. Furthermore, manual handling introduces a persistent physical risk of causing mechanical damage to the PCB substrate [50].
Automated optical inspection (AOI) systems are widely accepted as the optimal paradigm for PCB quality assurance. Following correct parameterization, these machines execute fully automated, non-contact diagnostic sequences, yielding significantly elevated defect capture rates while completely eliminating the risk of physical handling damage to the circuit boards.
As substantiated across numerous recent publications, the primary barrier preventing the universal adoption of industrial AOI setups centers on their prohibitive capital costs [5, 7, 50, 51]. An AOI unit can be configured with various hardware and software matrices; nevertheless, its underlying architecture uniformly relies on a pipelining of multiple sequential processing phases. This workflow begins inside an image acquisition enclosure, proceeds through a series of parameterized image processing algorithms, and typically concludes with a template-matching image subtraction sequence following initial feature extraction. Figure 15 illustrates a conventional operational pipeline for an AOI application.
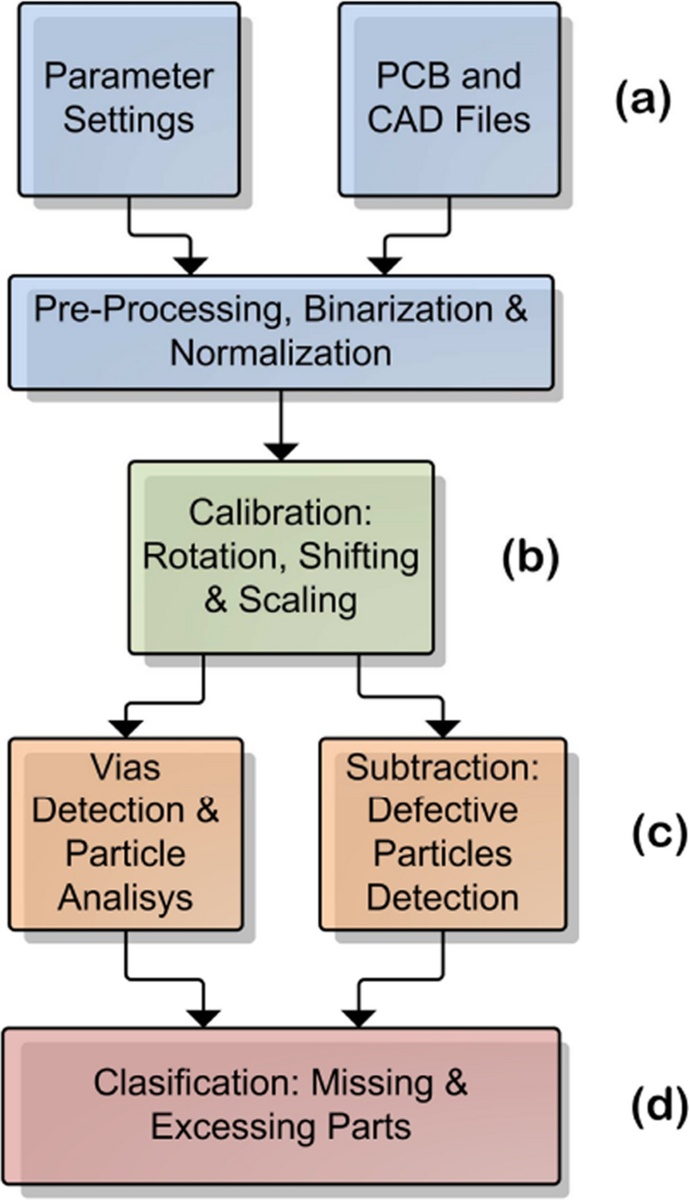
Figure 15. Overview of AOI system steps, by Sanguino [52]
Following calibration, contemporary AOI machines are capable of automatically extracting microscopic image features (e.g., $15\ \mu\text{m}$) from both the baseline template and the board under test, leading to highly accurate quality control metrics. Certain specialized AOI platforms can achieve defect detection rates exceeding 99% for BPCBs. However, their practical operation is typically bound to an intensive, highly parameterized setup procedure tailored to each specific PCB variant, a constraint that can limit the total diversity of defect classes simultaneously monitored by the system [52]. Additionally, inspection throughput speed remains a key operational challenge, fluctuating wildly based on the exact configuration of the image processing pipeline and occasionally requiring more than ten seconds to evaluate a single PCB unit.
Current SOTA publications focus on mitigating these legacy AOI constraints by embedding AI methodologies across various stages of the processing pipeline [5, 51, 52]. The primary goals of these initiatives are to accelerate inference velocities and establish more self-adaptive parameter optimization routines, which together could drastically minimize the total cost of ownership and deployment barriers.
One of the earliest open-access PCBA repositories was published by Pramerdorfer and Kampel [53] in 2015, comprising 748 PCB instances salvaged from an electronics recycling center. The images were captured under a highly rigorous photographic protocol, introducing significant domain and environmental variance into the dataset. The metadata annotations provide complete semantic segmentation maps for all PCBs alongside bounding box coordinates and descriptive metadata for 9,310 integrated circuits.
Huang et al. [10] emphasize the indispensable role that public data repositories play in establishing standard benchmarking baselines to guide downstream empirical research. Historically, PCB image datasets have remained sequestered as proprietary corporate data, with individual inspection systems developed and validated in isolation. The authors outline how this lack of standardized reference data hinders broader algorithmic development across the discipline. To address this deficiency, they released an open-source dataset consisting of 1,386 images captured from 10 distinct template BPCBs, encompassing six major defect classes: missing holes, mouse bites, open circuits, short circuits, spurs, and spurious copper. All identified anomalies are mapped with bounding box coordinates, and the rotated image variations are geometrically corrected to facilitate image registration research.
Adhering to a similar objective, He [31] introduced an additional BPCB benchmarking dataset containing the identical six prevalent BPCB defect classifications. For this repository, however, the images are standardized to a uniform resolution of $640 \times 640$ pixels and pre-binarized. Furthermore, the author incorporates a suite of digitally synthesized anomalies to expand the statistical representation of the positive defect class. The resulting repository contains 1,500 positive and negative BPCB image pairs, structured specifically to support the training of supervised template-matching frameworks.
Lu et al. [12] introduced a densely annotated PCBA dataset containing 9,912 images derived from 31 distinct PCBA configurations, tracking a total of 77,347 annotated components paired with comprehensive board metadata. The FICS-PCB repository contains bounding box coordinates alongside precise structural annotations for conductive traces, representing what was likely the largest open-source PCBA dataset available up until the year 2020.
In 2022, Jessurun et al. [54] introduced a new PCBA image repository that surpasses the scale of the FICS-PCB dataset, establishing itself as arguably the largest open-access SOTA dataset currently available. Their FPIC dataset delivers highly comprehensive annotation profiles, and the authors have committed to a periodic data acquisition strategy to ensure its long-term utility as a general-purpose open-source PCBA resource. The dataset supplies more than 58,000 individual annotations across 73 double-layer PCB specimens, mapping bounding box positions, component classifications, polygonal trace pathways, and extensive metadata arrays. Crucially, the FPIC repository stands as the first open-source PCB dataset to incorporate pixel-level component segmentation annotations.
Over the past quarter-century, research and development in printed circuit board (PCB) quality inspection have experienced major advancements, driven by enhanced hardware capabilities and innovative methodologies. A broad examination of the literature compiled in this review reveals distinct, consistent trends in PCB inspection techniques. Figure 16 illustrates these trends by outlining the primary logical operational workflows for both conventional and artificial intelligence (AI) methodologies. While certain studies rely entirely on classic image processing algorithms, others implement comprehensive AI models across the entire inspection sequence.
Tables 1 and 2 summarize the primary proposed method of each paper and their respective significant claims.
Table 1. Papers summary—part 1
References | Methodology | Registration-Oriented | Template Matching-Based | Main Contribution / Claim |
2010, 2011, 2012, 2018 [13, 14, 16, 20] | Traditional | Y | Y | Detection of 5–7 major defect types through XOR-based comparison and geometric feature analysis. |
2011 [15] | Traditional | N | N | Proposed an image enhancement technique to improve the preprocessing stage. |
2014 [23] | AI-Based | Not specified | Y | Identification and categorization of 14 defect classes using K-NN clustering methods. |
2017 [17] | Traditional | Y | Y | Developed a real-time AOI system with an inspection time of 2.53 s, capable of recognizing 14 defects. |
2018 [24] | AI-Based | N | N | Utilized LBP and HOG feature extraction techniques prior to SVM training. |
2019 [11] | AI-Based | N | N | Introduced a deep-learning-based detector achieving 98.9% mAP on the public dataset from Huang [10]. |
2019 [29] | AI-Based | Not specified | N | Presented a self-supervised learning approach for handling concept drift, employing a pre-trained VGG16 backbone network. |
2020 [31] | AI-Based | N | Y | Applied self-supervised learning for image similarity assessment and released a public BPCB dataset. |
2021, 2022 [5, 32] | AI-Based | N | N | Adapted the YOLOv5 architecture for generalized defect detection tasks. |
Table 2. Papers summary—part 2
Year | Methodology | Registration-Oriented | Template Matching-Based | Main Contribution / Claim |
2006 [41] | AI-Based | N | N | Implemented a supervised MLP model to identify 5 types of solder-joint defects. |
2010 [36] | Traditional | Not specified | N | Introduced a feature extraction framework for analyzing solder joints. |
2013 [42] | AI-Based | Y | Y | Employed a genetic algorithm within a supervised learning framework that remains resilient to concept drift. |
2013 [44] | AI-Based | N | N | Combined a genetic algorithm with an MLP to learn and recognize solder-joint defect patterns. |
2015, 2019 [37, 38] | Traditional | Y | Y | Developed geometric feature extraction methods to support image-subtraction-based inspection. |
2019 [39] | Traditional | N | Y | Applied a Fourier transform to image pairs prior to subtraction, enabling robustness against image misalignment. |
2019 [45] | AI-Based | N | N | Utilized a modified YOLOv3 architecture for large-scale PCB component detection, serving as a supporting tool for AOI systems. |
2020 [40] | Traditional | Y | Y | Proposed the SHADE algorithm for detecting contrast variations produced by multiple projected shadows on inspected objects. |
2021 [47] | AI-Based | N | N | Adopted YOLOv4 for solder-joint defect inspection using a private dataset containing 40,000 samples, achieving a high level of accuracy. |
2022 [49] | AI-Based | Not specified | N | Integrated several conventional feature extraction techniques with subsequent machine learning methods, emphasizing defect detection in concept-drift environments. |
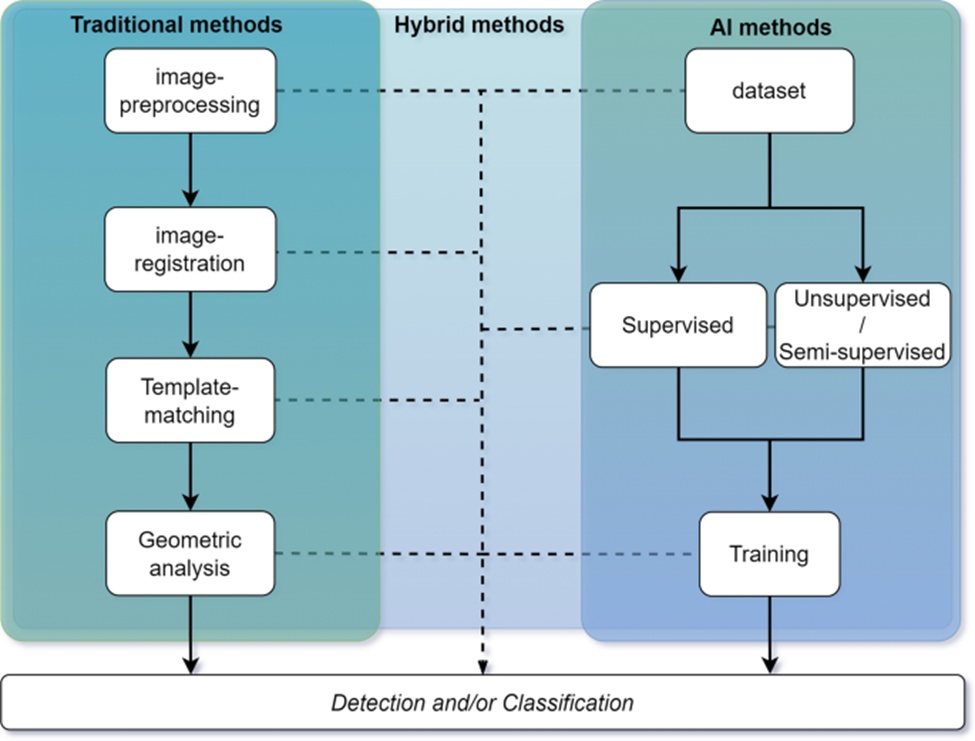
Figure 16. Summary of most common AOI logical operations flowcharts
Despite the unique variations introduced by individual studies, a core set of essential steps continues to define the standard framework for automated optical inspection (AOI) systems. Consequently, contemporary AI-driven strategies still frequently incorporate traditional methods, such as template-matching. These integrated frameworks are classified as hybrid approaches because they move away from the repetitive, exclusive reliance on either strictly conventional or purely AI-based operations. For instance, [23, 42] paired self-supervised AI architectures with template-matching strategies, whereas [5, 11, 24, 32, 41, 44, 45, 47, 49] deployed comparable AI frameworks directly on evaluation samples without using reference template images. Additionally, while [23, 31, 41, 42, 44, 47] coupled AI with traditional image registration methods, [5, 29, 32, 45] proved that AI models can be engineered to remain resilient when processing unregistered images.
The majority of conventional techniques depend on a template-matching framework paired with image registration, utilizing a flawless PCB image as a baseline reference against the board under test. Various operations can be executed between these two images, including image subtraction and logical XOR operations. The primary objective of template-matching is to isolate geometric variations between the samples, subsequently applying specific transformation rules to filter these differences and categorize them as anomalies. Conversely, full-AI strategies demand a comprehensive training dataset consisting of numerous PCB images, allowing the algorithm to learn the precise appearance and location of defects.
Hybrid strategies attempt to merge the strengths of both paradigms to mitigate their individual drawbacks. For example, it is possible to train a template-matching AI network to autonomously compare pairs of images. This eliminates the need for intricate image pre-processing stages and strict image registration, yielding a more adaptable solution across diverse PCB designs [31]. Alternatively, [49] illustrates how pairing well-established, older image pre-processing routines with less complex machine learning models can enhance adaptability in shifting environments, markedly boosting overall inspection capabilities.
Evaluating which specific method delivers superior accuracy and detection performance remains challenging due to a pronounced shortage of standardized, public PCB datasets for benchmarking. Because a significant portion of this research is funded by private enterprises, studies typically rely on proprietary data. This prevents fair, direct comparative evaluations across different methodologies. To resolve this bottleneck, some researchers have begun systematically gathering, labeling, and publishing PCB image repositories for public use [10, 31, 54]. Nonetheless, a large share of the reviewed literature continues to utilize restricted data. Furthermore, these proprietary datasets frequently lack a sufficient volume of images to guarantee statistical reliability, meaning this overview cannot serve as a direct benchmark for performance metrics.
This scarcity of comprehensive PCB datasets represents one of the primary roadblocks for deep learning models in this domain. Modern, state-of-the-art computer vision applications generally owe their success to training datasets that exceed 100,000 samples, frequently surpassing 10,000,000 instances. In comparison, the two largest open-source PCB repositories contain roughly 10,000 images—a substantial baseline, yet one that leaves significant room for growth.
Aside from the difficulties surrounding direct performance benchmarking, a long-term historical view reveals consistent progress in detection accuracy, public data availability, and the variety of defect categories an individual system can identify. These advancements appear tightly linked to a growing industrial requirement for AI-compatible workflows. Looking at the surveyed literature, Figure 17 tracks the shifting balance between traditional and AI-driven methodologies over the last 25 years. Prior to 2004, all documented systems relied on traditional, deterministic algorithms that required intensive pre-processing and were confined to identifying a narrow range of defects. Following the deep learning breakthrough around 2010 [55]—which popularized neural networks through optimized optimization algorithms and superior hardware compute—AI techniques claimed a 33% share of PCB inspection studies. By 2022, this share grew exponentially, with more than half of the published research adopting sophisticated, adaptive AI models that reduce pre-processing requirements and enable more generalized classification.
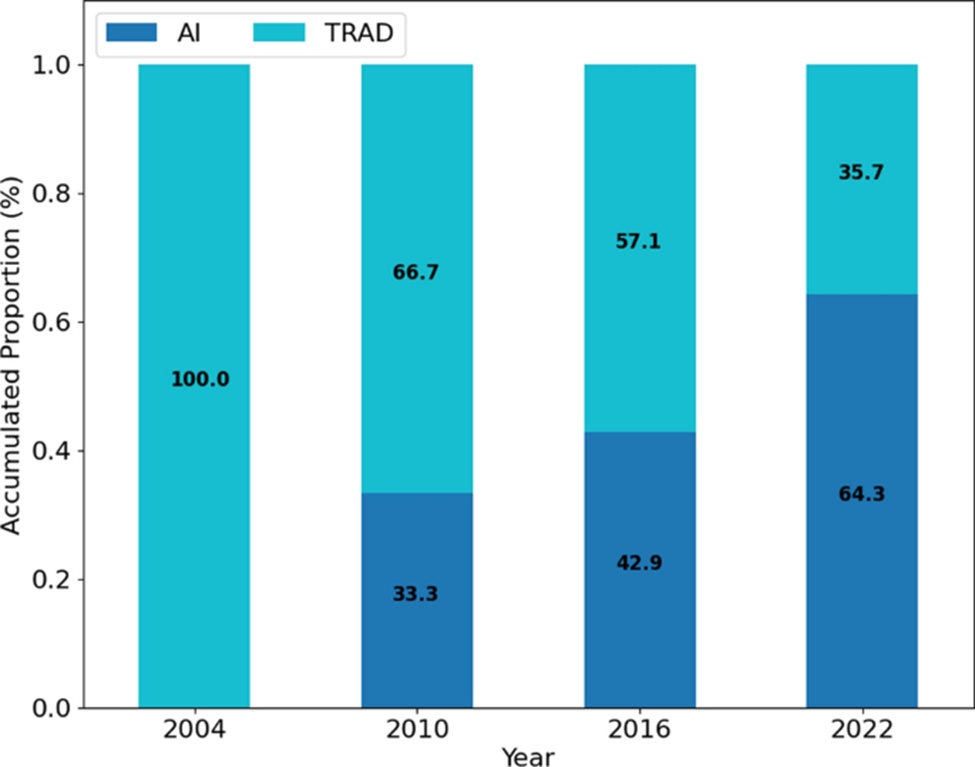
Figure 17. Accumulated relative proportion over years of papers concerning their main PCB inspection approach; if included only traditional techniques or also with AI
Ultimately, the expanding role of AI models introduces not only marked performance gains but also highlights an intricate obstacle within manufacturing environments: the phenomenon of concept drift. With the introduction of any new PCB layout, there is a high likelihood of encountering unfamiliar components, updated architectures, and distinct trace patterns. This variance is even more pronounced in printed circuit board assemblies (PCBAs) than in bare PCBs (BPCBs) due to the higher diversity of attached parts. Concept drift represents a major vulnerability for AI models trained exclusively on legacy board designs; because the models lack exposure to these updated visual characteristics, their accuracy suffers due to data bias.
To counteract these concept drift issues, several recent publications have introduced hybrid strategies designed to train models on older PCB variations while minimizing sensitivity to structural layout alterations, thereby establishing resilience against drift [42, 49]. Even so, these solutions frequently lag behind specialized, single-board models in raw accuracy scores. Furthermore, as shown in Figure 18, they constitute only a minor fraction of the broader PCB inspection literature that actively addresses this challenge.
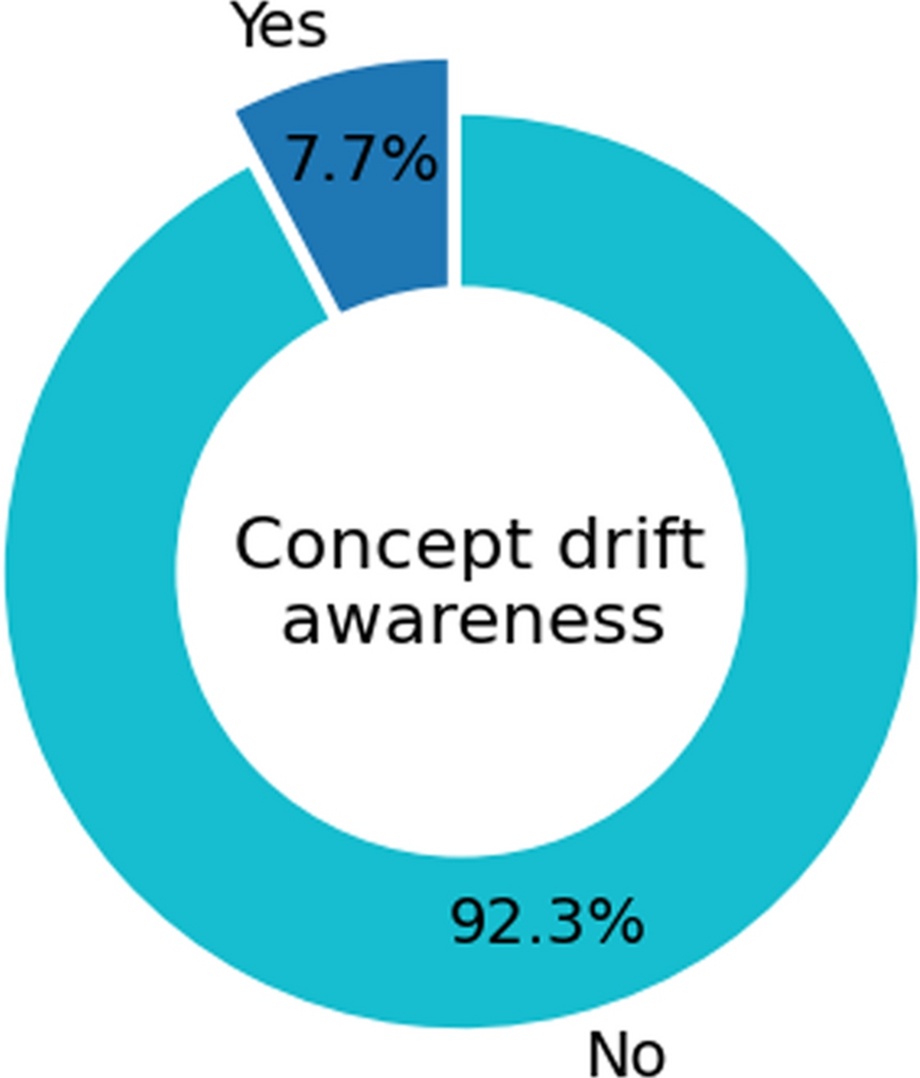
Figure 18. Relative proportion of the analyzed papers that were concerned with the concept drift problem
This review provides a chronological and thematic evaluation of literature focused on printed circuit board (PCB) quality inspection over the last 25 years. It outlines how PCB evaluation environments are generally split into two primary segments—bare PCBs (BPCBs) and printed circuit board assemblies (PCBAs)—tracking the core conventional methodologies deployed prior to the development of contemporary, real-time artificial intelligence (AI) solutions.
In the domain of BPCB inspection, recent implementations utilizing deep learning (DL) models appear to have largely resolved the challenges associated with trace and pad verification, routinely achieving accuracy rates nearing 100%. Conversely, PCBA inspection has not achieved the same level of definitive success. Inspecting PCBAs introduces a more intricate set of challenges due to the vast diversity and rapid iteration cycles of components, factors that frequently trigger concept drift issues for AI frameworks. Despite these hurdles, contemporary PCBA inspection systems can successfully identify thousands of distinct electronic components within fractions of a second, substantially boosting the detection quality, efficiency, and cost-effectiveness of automated optical inspection (AOI) machinery.
A major bottleneck in current research and development is the scarcity of standardized, public PCB datasets that can function as benchmark references across studies to establish a universal performance hierarchy. Consequently, the summary tables in this review omit a direct, standardized performance metric, given that the findings of each study are inherently tied to its proprietary testing data. For instance, several state-of-the-art AI studies evaluated in this review present high-tier performance outcomes but remain restricted to proprietary data repositories, which hinders the reproducibility of these milestones. Nevertheless, a number of valuable PCB datasets have been released to the public domain over the last five years, a development that could catalyze significant methodological advancements in upcoming literature.
With respect to data efficiency, numerous frameworks continue to rely heavily on AI models trained across thousands of images extracted from high-cost, private datasets. From an engineering standpoint, this remains a suboptimal strategy for industrial manufacturing environments, which are characterized by frequent product line transitions and are therefore highly susceptible to concept drift. Accordingly, future advancements in deep learning applications within this field must focus heavily on constructing more data-efficient architectures to effectively mitigate these operational constraints.
None
None
This study was financed in part by the project “Sistema de visão para detecção de falhas em processo de fabricação de dispositivos portáteis”, financed by Samsung Electronics of Amazônia Ltda., under the Brazilian law of informatics n. 8.248/91. This study was financed in part by the Coordenação de Aperfeiçoamento de Pessoal de Nivel Superior—Brazil (CAPES)—Finance Code 001.
None
Open Access The author(s) retain copyright. This article is licensed under the Creative Commons Attribution-NonCommercial-ShareAlike 4.0 International License. It may be shared and adapted for non-commercial purposes with appropriate attribution, an indication of changes, and distribution of adaptations under the same license. Third-party material may be subject to separate terms identified in its credit line. View the license at https://creativecommons.org/licenses/by-nc-sa/4.0/.
 Transparent Intelligence Publishing