Breast cancer represents a leading cause of mortality among women. Consequently, early detection is crucial for effective screening and reducing the overall death rate. Therefore, the development of computer-aided diagnosis systems is essential for identifying breast cancer in its initial stages. Because of its affordability, ultrasound serves as a vital examination tool for breast cancer diagnosis. Although numerous learning-based methods have recently been introduced to categorize breast cancer using the breast ultrasound imaging (BUSI) dataset, manual processing remains a difficult and highly time-consuming task. This study presents an XAI-based framework utilizing an EfficientNet-integrated ResNet deep network to precisely categorize breast cancer as either benign or malignant. Initially, data augmentation is applied to expand the training sample size. To achieve this, three-pixel flip mathematical equations are implemented: horizontal, vertical, and 90°. Subsequently, two pre-trained deep learning models are utilized, selectively skipping specific layers before fine-tuning. These adjusted models are then trained via a deep transfer learning process to extract features from their deeper layers. The performance of these trained models is evaluated utilizing explainable artificial intelligence (XAI). Following this, a novel feature selection approach known as cuckoo search controlled standard error mean is introduced, which is grounded in the cuckoo search algorithm. This method isolates the optimal features, which are then combined using a novel parallel zero-padding maximum correlated coefficient fusion technique. Finally, the selection algorithm is re-applied to the integrated feature vector prior to classification via machine learning algorithms. Experimental evaluations of the proposed framework, performed on the publicly accessible BUSI dataset, achieved accuracies of 98.4% and 98% across two distinct experiments. Comparisons with contemporary techniques demonstrate that the proposed framework offers enhanced accuracy. Furthermore, it requires less execution time compared to the standalone original deep learning models.
Statistical data indicates that breast cancer ranks as the fifth leading cause of cancer-related fatalities [1]. It remains a primary contributor to both morbidity and mortality among the female population. The successful early identification and effective treatment of breast conditions rely heavily on precise diagnoses derived from breast ultrasound (BUS) imaging [2]. Biopsy represents the most definitive method for breast cancer diagnosis [3], with its pathological findings regularly serving as the clinical standard. Nevertheless, biopsies require significant material and personnel resources and carry the risk of damaging normal physiological tissues, which can cause both psychological distress and physical discomfort. As a result, biopsies are not always the optimal choice for patients.
Rapid progress in computer technology has driven the evolution of medical imaging, prompting the creation of various innovative methods for breast cancer diagnosis [4]. Ultrasonography (US) has increasingly become a standard supplementary approach for detecting breast cancer, favored for its high sensitivity, safety, and adaptability [5]. In recent years, ultrasound imaging has garnered significant attention owing to its numerous advantages, including cost-effectiveness, absence of radiation, rapid image acquisition, and elevated precision and sensitivity [6]. Breast ultrasound (BUS) stands as one of the most affordable imaging modalities in clinical medicine. While physical examinations mainly aim to detect breast tumors or other abnormalities, BUS provides a radiation-free and entirely safe alternative [7]. Generally, BUS images exhibit low contrast, poor quality, and significant ambiguity. The primary sources of this uncertainty include: (i) the acquisition of BUS images under diverse conditions, times, and with different equipment; (ii) the inherent anatomical variations in breast characteristics among individuals; and (iii) the inherently low resolution of BUS images, which by default contain noise and speckles. Furthermore, the quality of these images is heavily influenced by the specific techniques and expertise of the radiologists acquiring them [8].
Ultrasound remains an operator-dependent modality. Consequently, diagnostic results can vary widely among doctors with different levels of medical training, making it essential for highly trained and experienced radiologists to evaluate these ultrasound images [9]. Unfortunately, suboptimal image quality and individual anatomical differences occasionally prevent radiologists from accurately diagnosing BUS scans. To address this, computer-aided diagnosis (CAD) systems have been developed to minimize inter-observer variability among various radiologists, thereby yielding more trustworthy and precise diagnostic outcomes [6].
Within a CAD system, image segmentation generally serves as a fundamental prerequisite for subsequent processing stages [10]. Thus, developing an accurate and robust segmentation algorithm for BUS images is of paramount importance. Extracting lesions from BUS images, however, remains challenging due to the following issues: (i) inferior image quality leads to indistinct borders, irrespective of whether the lesion is malignant or benign; and (ii) the extensive variation in the location, shape, and size of the lesions introduces additional complexities for segmentation algorithms [11]. Traditional BUS segmentation methods are primarily categorized into region-based and model-based techniques. Region-based approaches execute image segmentation by evaluating the similarities between adjacent regions or pixels, alongside predetermined constraints like the geographical placement, appearance, and shape of the lesion regions. Conversely, model-based methods—including Markov random-field, active contour, and graph-based models—utilize unique prior/posterior-based energy functions to construct models, finding widespread application in BUS image segmentation [11].
Automatic classification of breast ultrasound images frequently employs deep learning-based techniques, with researchers consistently advocating for multi-model and multi-image fusion strategies [12]. Research has shown that various types of breast ultrasound imaging (BUI) can be effectively utilized to differentiate between malignant and benign breast lesions [13]. The analysis of BUS images has been applied in numerous investigations to categorize breast cancers. Evidence suggests that textural and morphological characteristics are especially valuable in discriminating between benign and malignant tumors. Furthermore, combining these two distinct feature sets has been reported to enhance the precision of tumor classification. Morphological features specifically quantify the geometrical attributes of the tumor, including its margins, regularity, orientation, shape, and area [14]. To overcome these challenges, we introduce a deep learning architecture incorporating a gated recurrent unit (GRU) module alongside an innovative feature selection algorithm. The principal contributions of this research are defined as follows:
To enhance learning performance, data augmentation is executed through the development of three-pixel flip mathematical equations.
The modified ResNet18 and EfficientNet-b0 models are modified via the integration of a multi-head self-attention mechanism and a GRU module. Furthermore, their final layers are fine-tuned and trained utilizing a deep transfer learning process, with subsequent performance analysis conducted using the Explainable AI (XAI) tool GradCAM.
An innovative feature selection method, termed cuckoo search controlled standard deviation and Newton Raphson, is introduced based on the cuckoo search algorithm.
A unique fusion approach, designated as the parallel zero-padding max correlation coefficient, is proposed.
Over the past few years, numerous medical assistance systems have been developed as interest in computer-aided problem-solving within the healthcare sector continues to grow. Case-based reasoning (CBR) frequently serves as a foundational recommendation mechanism in clinical applications, particularly within medical support systems [15]. CBR offers several distinct advantages over alternative AI methodologies. For instance, it bypasses the need for an explicit domain model and demands less effort to isolate critical variables that accurately depict a given scenario. Furthermore, it allows for the retention of extensive data, enabling the system to evolve by acquiring new case instances [16]. In advanced diagnostic pipelines, artificial intelligence (AI) tools evaluate medical records and patient data to formulate prospective diagnoses. By efficiently processing massive datasets and recognizing patterns that human physicians might miss, AI frameworks can facilitate rapid and precise clinical assessments [17].
The evaluation of breast ultrasound images (BUI) has been widely applied in studies aiming to categorize breast malignancies. Evidence indicates that textural and morphological features are especially valuable for differentiating between benign and malignant tumors [18]. Convolutional neural networks (CNNs) represent a modern and highly effective technique for the segmentation and classification of breast ultrasound scans, serving as a powerful tool for early diagnosis. Hossain et al. [19] conducted a comparative study of transfer learning models, ensemble methods, and vision transformers utilizing explainable AI. Utilizing a brain tumor dataset containing 3264 images, their experiments yielded a peak accuracy of 94.5%, with model evaluations grounded in explainable AI. The primary limitation of this research was the lack of diversity and limited volume of the chosen dataset. Daoud et al. [20] utilized a pre-trained CNN to accurately classify BUS images, comparing primary techniques such as transfer learning and deep feature extraction. Their findings indicated that deep feature extraction outperformed the transfer learning approach. Furthermore, combining robust feature selection with deep feature extraction from the pre-trained CNN yielded an accurate BUS image classification rate of 93.9%. Ding et al. [21] introduced a novel multiple-instance learning (MIL) approach for categorizing BUS images. Initially, a self-organizing map mapped the instance space into a concept space. A bag feature vector was subsequently constructed based on the distribution of instances within this space, and a support vector machine (SVM) classifier categorized the tumors. Experimental outcomes demonstrated that this method could achieve superior performance with an accuracy of 91.07%. Elsborg et al. [22] introduced an analysis framework for biomarkers based on explainable machine learning (ML) and large language models (LLMs). The researchers applied a regression algorithm alongside scBERT, utilizing an scRNA-seq dataset for their experiments. Zhuang et al. [13] proposed a reliable classification method for breast cancer ultrasound images by combining adaptive spatial feature fusion with image decomposition techniques. The raw breast ultrasound images were initially refined using fuzzy enhancement and bilateral filtering. Subsequently, mask and original images generated various decomposed outputs highlighting the clinical characteristics of the breast cancers. An optimal base model was selected from multiple candidate deep learning architectures to extract features via transfer learning. Ultimately, the adaptive spatial feature fusion mechanism was applied during the classification network's training phase to achieve unified feature fusion and categorization. This study collected 1328 breast ultrasound images for training and testing, achieving a maximum accuracy of 95.48%.
Singh et al. [23] recommended integrating an atrous convolution layer into a conditional generative adversarial network designed for segmentation, enabling the identification of tumor characteristics across different BUS image resolutions. This approach automatically rebalanced the relative influence of top-level encoded features. Additionally, the study proposed incorporating a channel-wise weighting block into the network. The model underwent training utilizing L1-norm and SSIM losses alongside standard adversarial loss. The classification phase revealed that a few statistical parameters extracted from the predicted mask's boundary design could reliably separate benign and malignant tumors, attaining an 85% accuracy rate. Zhouet et al. [18] applied the shearlet transform to derive textural feature descriptors. To evaluate consistency, these features were supplied to two distinct classifiers: AdaBoost and a support vector machine (SVM). The experimental results showed breast tumor classification accuracies of 91.0% for SVM and 90.0% for AdaBoost. These findings highlight the potential of this technique for breast CAD systems and its capacity to categorize breast cancer features in ultrasound scans. Yusufiyah et al. [24] proposed classifying BUI lesion shapes via image processing, contrasting two feature extraction methods: invariant moments and Zernike moments. The input scans were filtered using an adaptive median filter before undergoing segmentation via Chan-Vese active contours. Feature extraction relied on Zernike and invariant moments, while classification was handled by multilayer perceptrons and SVMs. This proposed method successfully categorized 80% of the 45 evaluated photos. Shi et al. [25] improved the representational capacity of a standard dual path network (DPN) by implementing a stacked DPN (S-DPN) approach. They utilized prostate ultrasound elastography and breast B-mode datasets for tumor classification. Experimental results indicated that the S-DPN yielded peak performances of 92.40% and 90.28% on the breast and prostate ultrasound datasets, respectively. Bing et al. [26] established a novel BUI classification method utilizing multiple-instance learning grounded in sparse representation. Following image enhancement and segmentation, local and global features were extracted utilizing a concentric circle model to improve diagnostic and predictive accuracy. The ultrasound classification task was reformulated as a MIL problem via sparse representation. A bag's representation consisted of a singular feature vector formed by merging all dictionary basis vectors into sparse linear combinations for every instance within the bag. The final classification aggregated the outputs of individual classifiers. Initial BoW feature combinations yielded an 84.72% basic classification accuracy rate; subsequently, implementing LDA dimensionality reduction across four concentric circle layers improved the classification accuracy to 86.34%. Wang et al. [27] provided a comprehensive review on the development and deployment of explainable AI methods in 6G technology, concluding that such methods mitigate risks by improving the transparency of black-box AI decision-making processes. Kalafi et al. [28] designed a unique classification framework for breast cancer lesions utilizing an attention module integrated into a modified VGG16 architecture. This attention mechanism enhanced the distinction between the targeted lesions and background ultrasonic features. To minimize discrepancies between identified lesions and their corresponding labels, they introduced a novel ensembled loss function combining the logarithm of the hyperbolic cosine loss with binary cross-entropy. This combined loss facilitated faster network optimization. Achieving a 93% accuracy rate, the proposed model exceeded the performance of existing modified VGG16 architectures.
Eroğlu et al. [29] developed a hybrid CNN framework to classify benign, normal, and malignant breast lesions from US scans. This hybrid architecture combined the MobilenetV2, Alexnet, and Resnet50 models. Features from these networks were extracted and concatenated independently, thereby expanding the utilized feature pool. Subsequently, the minimum redundancy maximum relevance (mRMR) feature selection technique isolated the most pertinent data for machine learning classifiers like KNN and SVM. The SVM classifier yielded the highest performance, reaching an accuracy of 95.6%. Silva et al. [30] proposed a data augmentation architecture utilizing explainable authorship. The researchers leveraged LLM models to engineer dataset augmentation strategies. Using a dataset of 1000 samples, they tested the generation of abstracts from a multimodal transformer. Finally, moon et al. [31] introduced a CAD system for tumor detection based on an image fusion technique. This method utilized an ensemble of diverse CNN architectures and varied image content representations applied to US scans. The proposed CNN ensemble included VGGNet, ResNet, and DenseNet. Evaluated on an open dataset (BUSI) containing 697 tumors—consisting of 133 normal images, 210 malignant tumors, and 437 benign lesions—this approach achieved an accuracy of 94.62%.
In summary, the methodologies reviewed above predominantly exhibited the following limitations: (i) The aforementioned techniques largely overlooked data augmentation strategies to address imbalanced datasets, which ultimately compromised accuracy; (ii) The utilized deep learning models lacked fine-tuning regarding the addition or omission of specific layers; and (iii) Relying on single-source features proved insufficient for achieving target accuracies. Although some researchers attempted to address the feature source issue, they failed to adequately manage the challenge of irrelevant and redundant features. To overcome these obstacles, this study proposes a novel framework utilizing data-augmented deep learning and the optimal selection of fused features to precisely classify breast cancer from the BUSI dataset.
In this section, a comprehensive deep learning pipeline is introduced for categorizing breast ultrasound images. The architecture of the proposed framework is depicted in Figure 1, demonstrating the application of the BUSI dataset throughout the experimental procedures. Initially, data augmentation is executed on the chosen dataset to resolve class imbalance issues. Subsequently, two adapted architectures—a self-attention integrated ResNet-18 and a GRU-enhanced EfficientNet-b0—are deployed. Both networks are trained via deep transfer learning. To facilitate feature extraction, GRU activations and self-attention mechanisms are utilized. Following extraction, an advanced feature selection strategy—specifically, the cuckoo search controlled standard deviation combined with the Newton Raphson method—is applied to pinpoint the most effective features. Next, a minimum correlated serially fused approach is designed to amalgamate these optimal features. This fused set is then subjected to a secondary round of feature selection. In the concluding phase, multiple classifiers perform the final classification.
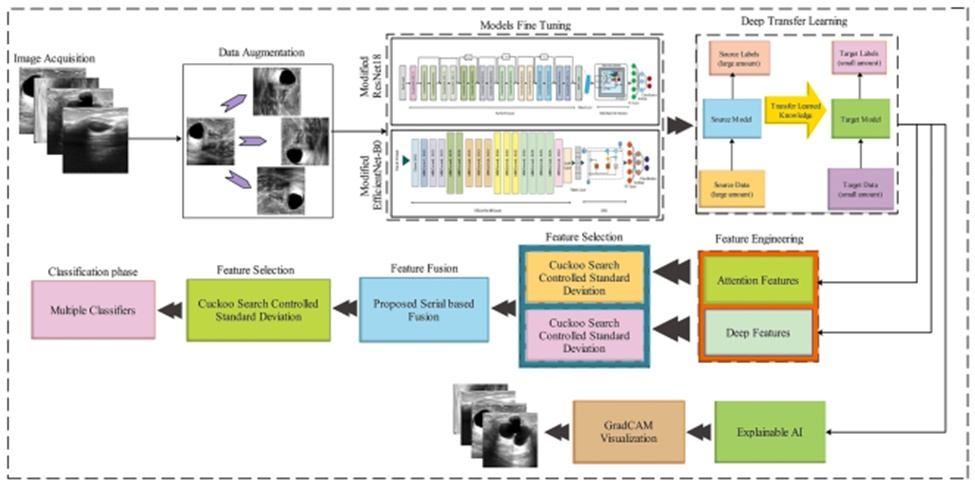
Figure 1. The proposed augmented deep learning and optimal fused features framework of breast cancer classification.
The baseline dataset comprises breast ultrasound images from female patients aged between 25 and 75, compiled in 2018 [31]. The cohort consists of 600 women. In total, the dataset contains 780 images, saved in PNG format with an average resolution of 500 by 500 pixels. These images are classified into three distinct categories: malignant, benign, and normal. Figure 2 displays representative images from the selected dataset.
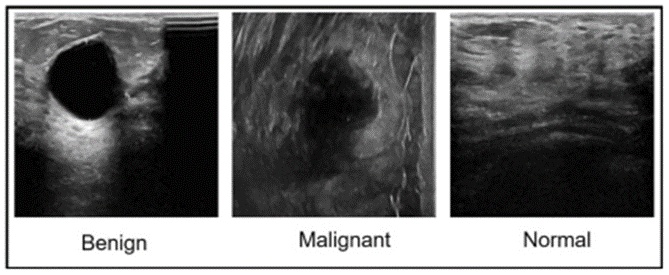
Figure 2. Sample ultrasound images of the BUSI dataset. BUSI, breast ultrasound imaging dataset.
Data augmentation encompasses various strategies to artificially expand the volume of data by generating novel data points from pre-existing ones. By introducing diverse and unique examples into the training sets, data augmentation significantly enhances both the outcomes and performance of ML models [32]. Consequently, sufficiently large and varied datasets directly improve the precision and capabilities of machine learning (and deep learning) architectures. In this study, three specific mathematical equations are deployed during the augmentation phase to increase the diversity of the original dataset. These equations are specified below:
Let the original image be represented by Ψ(x, y), where the entire dataset is denoted by Δ ∈ Ψ(x, y).
The initial equation shifts all image pixels horizontally to the right. The second equation rearranges the pixels of the original image into a vertical sequence. Finally, the third equation also aligns the image pixels vertically.
 (1)
 (2)
 (3)
Visual representations of the outputs generated by these equations are provided in Figure 3. Following augmentation, the target dataset size reaches approximately 12,000 images, ensuring that each class contains more than 3000 instances.
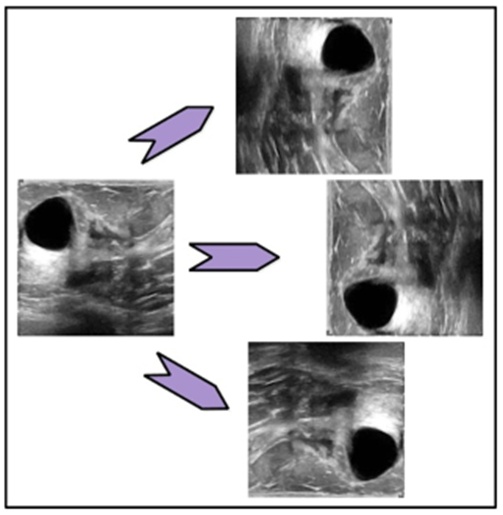
Figure 3. Visual sample images of data augmentation using three mathematical equations.
Modified EfficientNet-b0: The EfficientNet-b0 convolutional neural network was originally trained on over one million images from the ImageNet database. This pre-trained architecture can classify images into 1000 distinct object categories, including diverse items such as a mobile phone, a banana, and a tiger. Consequently, the network has developed robust visual feature representations across a wide spectrum of images. It processes inputs at a resolution of 224 by 224 pixels. For this study, EfficientNet-b0 is modified by integrating a GRU module. Specifically, the final three layers—the fully connected, softmax, and classification layers—are eliminated. Following the global average pooling layer, a flatten layer is introduced to translate 2D spatial information into a 1D format. Subsequently, a GRU is appended, featuring 1280 hidden units, utilizing tanh as the state activation function and log-sigmoid for the gate activation function. Finally, the fully connected, softmax, and classification layers are reattached and fine-tuned via deep transfer learning. Through these modifications, the model gains the capacity to extract hierarchical image features and encode sequential dependencies, resulting in a profound and comprehensive representation of the input data. This enhances deep feature representation specifically optimized for the task at hand. The structure of the modified EfficientNet-b0 is illustrated in Figure 4.
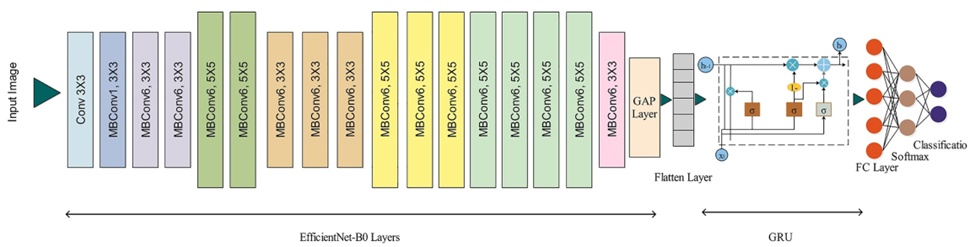
Figure 4. Modified with GRU module architecture of EfficientNet-b0. GRU, gated recurrent unit.
Modified ResNet-18 is an 18-layer convolutional neural network. Similar to EfficientNet, its pre-trained iteration is available via the ImageNet database, trained on over a million images. This pre-trained network categorizes images into 1000 object classes, including items such as a pen, a monkey, and a car. Consequently, the network has accumulated an extensive repository of visual information for diverse images. It also accepts input images sized at 224 by 224 pixels. In this research, a modified ResNet-18 is proposed for the classification objective. This modification involves integrating a multi-head self-attention mechanism into the ResNet-18 architecture. The terminal three layers are removed, replaced by a flatten layer. Following this flatten layer, a multi-headed self-attention block is incorporated, comprising 384 keys and six heads. Through this enhancement, the model captures intricate contextual data by analyzing associations among all points within the input feature maps. This adaptability renders the model highly effective for tasks characterized by irregular patterns. The modified ResNet-18 model is depicted in Figure 5.
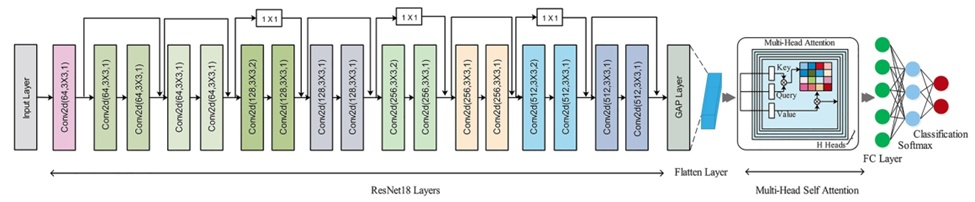
Figure 5. Modified architecture of ResNet-18.
EfficientNet-B0 was chosen for this study based on its parameter efficiency, transfer learning capabilities, and cutting-edge performance. Conversely, ResNet-18 was selected due to its rapid training speed, ease of implementation, interpretability, and validated performance across diverse datasets.
Transfer learning aims to boost the performance of target learners operating in target domains by leveraging knowledge acquired from multiple, related source domains [33]. It utilizes a learning paradigm established on an initial dataset to address a novel, related challenge more efficiently and rapidly. Figure 6 visualizes the operational flow of transfer learning.
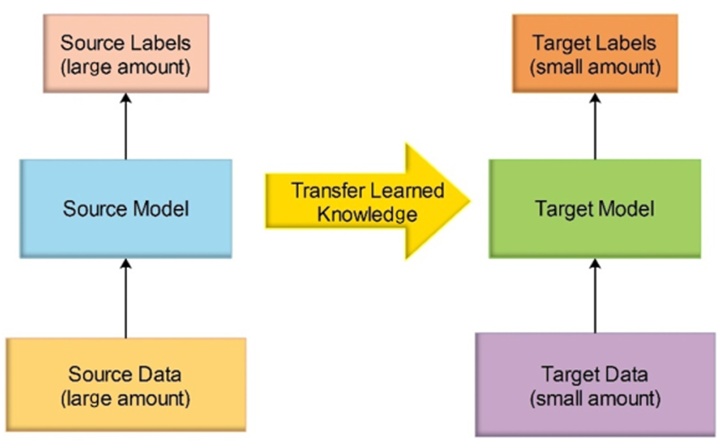
Figure 6. The process of transfer learning.
A domain ∂ consists of two primary elements: a marginal distribution f(V) and a feature space V. Simply stated, ∂ = {V, f(V)}. Furthermore, V represents an instance set, formulated as V = {V | Vl ∈ V, l = 1,2,3…m}. A task τ comprises a label space ρ and a decision function ∝, resulting in τ = {ρ, ∝}. It is presumed that the decision function ∝ is implicitly derived from the sample data. During the transfer learning process, several hyperparameters are initialized, including the optimizer, epochs, regularization factor, momentum, and learning rate. The learning rate is set at 0.0004 for the ResNet model and 0.0002 for EfficientNet-b0. These specific values were determined following extensive hit-and-trial experimentation. The stochastic gradient descent (SGD) optimizer is utilized for both fine-tuned architectures. Both deep models are initialized with 100 epochs and a momentum value of 0.743.
Following the training phase of both fine-tuned models, their respective global average pooling layers are activated to extract deep features. These deep testing features are structured as feature vectors, defined as Fres = N × 512 and Feff = N × 1280.
Recognized as a crucial data pre-processing technique, feature selection has demonstrated substantial efficacy in machine learning for managing high-dimensional data [34]. The objective of feature selection is to optimize the utility of the input data by eliminating irrelevant and redundant information, thereby facilitating accurate classification. High-dimensional data not only increases computational overhead but also exacerbates the risk of overfitting [35].
In this research, a novel feature selection methodology is proposed, integrating the Newton Raphson method with the cuckoo search algorithm. This proposed approach is termed the cuckoo search controlled standard deviation and Newton Raphson technique. Initially, features are evaluated and selected using the cuckoo search algorithm. Subsequently, features that meet specific standard deviation thresholds proceed to the next phase. Ultimately, the stopping criteria are determined by a novel function grounded in the Newton-Raphson method. The cuckoo search process initiates by simulating cuckoo breeding behaviors. Because cuckoos employ a highly aggressive reproductive strategy compared to other avian species, they occasionally evict the eggs of host birds to increase the survival probability of their own offspring. The cuckoo either discards the host eggs or entirely abandons the nest to establish a new one elsewhere. Following this behavioral phase, a Lévy flight step is executed. Lévy flights consist of random walks characterized by arbitrary directions. In contrast to standard random walks, Lévy flights can reduce the required number of optimization iterations by approximately four orders of magnitude [34].
Cuckoo Search Algorithm: The CS optimization algorithm is founded upon three principal rules: (i) Each cuckoo independently selects a nest and deposits a single egg; (ii) The superior nests, containing eggs of the highest quality, are preserved and carried forward to subsequent generations; (iii) Given a fixed number of available nests, a host cuckoo has a probability between [0,1] of identifying an alien egg. Upon this discovery, the host cuckoo must decide between two actions: either discard the foreign egg or abandon the current nest entirely to construct a new one in a different location.
This final rule can also be conceptualized as a fraction z_o of the n host nests being abandoned and replaced by newly constructed nests. In the context of maximizing solution suitability or efficiency, fitness is typically proportional to the significance of the objective function. Depending on the specific definition of the fitness function within the evolutionary algorithm, various other forms of fitness can be formulated. For practical implementation, the following straightforward representations can be adopted: each egg within a nest corresponds to a potential solution, with each cuckoo restricted to laying a single egg. The overarching objective is to utilize promising new solutions (cuckoos) to supplant and eliminate inferior solutions within the nests. It is worth noting that this methodology can be extended to more complex scenarios where a single nest holds multiple eggs, representing a set of diverse solutions. However, assuming a one-to-one relationship—where each nest contains only one egg, which in turn represents a single cuckoo—eliminates any functional distinction between the egg, the nest, and the cuckoo. The algorithm utilizes a switching parameter, denoted as z_o, to balance the application of a global explorative random walk against a local random walk. The local random walk is mathematically expressed as follows [34]:
 (4)
Here, R signifies the Heaviside step function, \partial represents a random value drawn from a uniform distribution, c determines the step size, and and denote two distinct solutions selected randomly via random permutation. Conversely, the global random walk is driven by Lévy flights [34]:
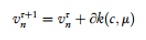 (5)
 (6)
In this context, the step size scaling factor, \partial > 0, must correlate with the inherent scales of the specific problem being addressed. Often, configuring \partial = O(k/10)—where k is the characteristic scale of the problem—is appropriate. However, setting \partial = O(k/100) can occasionally yield greater efficiency and prevent the algorithm from overshooting the optimal solution. The equation above defines a stochastic random walk. A random walk operates as a Markov chain, where the subsequent state or location is determined primarily by the current position and the transition probability (the second term in the equation). To prevent the system from stagnating in a local optimum, a substantial proportion of new solutions must be generated via far-field randomization. Therefore, the new locations must be adequately distanced from the current optimal solution.
To enhance the efficacy of the cuckoo search algorithm, this study proposes a novel sub-step selection function. This new function integrates the standard error mean (SEM) and the standard deviation (SD). The SD quantifies the variability among the features initially selected by the cuckoo search algorithm. Utilizing this SD, the SEM is then calculated to estimate the expected deviation of the sample mean from the features selected in the preceding stage. Initially, the standard deviation \sigma is calculated from these selected features using the following formula:
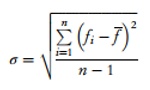 (7)
where fi represents the current feature from the cuckoo search's selected vector, indicates the mean value of the entire selected vector, and n specifies the total number of sample images. Subsequently, the standard error is calculated based on the \sigma value:
 (8)
Relying on the computed σ, the selection function is established as follows:
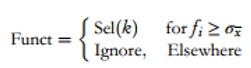 (9)
In the subsequent step, the probability of Sel(k) is evaluated to identify the most frequently occurring feature value. This most frequent feature is then incorporated into the defined function for final selection:
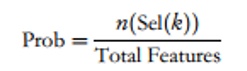 (10)
 (11)
 (12)
Here, Fsl(k) signifies the final features selected in each iteration. Fitness evaluation occurs after every iteration, utilizing Fine-KNN as the fitness function. The extracted features are then processed through the proposed cuckoo search controlled standard deviation and Newton Raphson feature selection method. The dimensions of the resulting feature vectors are N × 261 and N × 629, respectively, where N represents the total number of observations. These selected features are then subjected to a newly developed feature fusion technique.
Feature fusion involves combining distinct extracted characteristics, typically stored in a dictionary, into a single, highly informative feature file. Comparative analyses of feature fusion techniques suggest that specific metrics must be customized for each application to fulfill varying user requirements. In this study, we propose a parallel zero-padding correlation coefficient method for feature fusion. Let us assume two optimal feature vectors, ϕf1 and ϕf2, with dimensions N × 261 and N × 629, respectively. Initially, zero-padding is applied to equalize the dimensions of both vectors. We select the maximum feature vector dimension as the target length; therefore, the target dimension is N × 629. The zero-padding process is defined as:
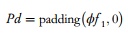 (13)
Following this, the similarity between the two vectors is calculated using the following formula:
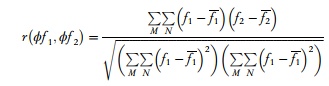 (14)
where M and N correspond to the dimensions of both feature vectors (which is 629 in this context). The resulting correlation value r falls within the range [-1, 1]. Consequently, the absolute value of r is computed to quantify the exact similarity between f1 and f2.
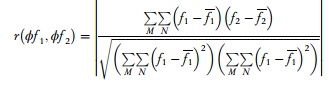 (15)
In this study, a threshold of r ≤ 0.30 is established to signify minimum similarity between features. Therefore, only features exhibiting minimum similarity are fused. The final fusion function is formally defined as:
 (16)
where Fus(k) represents the final fused feature vector, possessing a size of N \times 782. To further optimize this fused vector, the proposed optimization algorithm is reapplied, selecting the optimal features to yield a vector of size N \times 466. This final optimized vector is subsequently forwarded to the ML classifiers to complete the classification process.
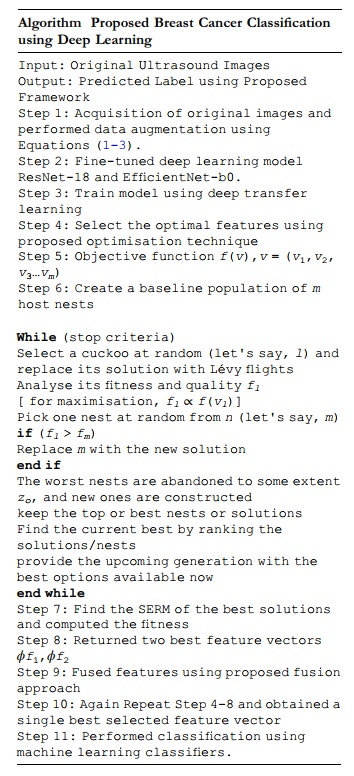
Algorithm 1. Proposed Breast Cancer Classification using Deep Learning
Dataset and Performance Measures: To validate the introduced methodology, we utilized an open-access breast ultrasound imaging dataset categorized into normal, benign, and malignant cases. The study implemented various machine learning (ML) algorithms, predominantly Support Vector Machines (SVM) and Neural Networks. We quantified the predictive capabilities of these classifiers using multiple metrics: accuracy (Acc), precision rate (PREC), sensitivity rate (SER), F1-Score (F1S), false negative rate (FNR), AUC, alongside processing time in seconds.
Experimental Setup: The data was split equally (50:50) to facilitate the learning and evaluation phases of the deep neural networks, meaning half the images per category were dedicated to training and the other half to testing. Throughout both phases, a 10-fold cross-validation strategy was applied. The deep networks were configured with specific tuning parameters: an optimizer set to SGD, a mini-batch size of 32, momentum at 0.7, 50 epochs, and a 0.0001 learning rate. All computational tasks were executed via MATLAB2022a on a Core i7 workstation equipped with 16GB RAM.
Numerical Results: This subsection outlines the quantitative findings derived from a sequence of six rigorous evaluations of the complete architecture. The primary trial involved classifying features derived from an optimized ResNet-18 model, with outcomes detailed in Table 1. Here, the Ensembled Subspace KNN (ESKNN) algorithm achieved a peak accuracy of 98.3%, complemented by an SER of 98.36%, a PREC of 98.33%, an F1S of 98.34%, and an FNR of 1.64%. Figure 7 provides a visual confirmation of these statistics via a confusion matrix, where the principal diagonal indicates correct classifications. Trailing just behind was the Fine KNN algorithm at 98.2% accuracy, while the Tri-layered NN performed the poorest at 95.9%. Processing speeds were concurrently monitored; the medium NN emerged as the most time-efficient at 8.3131 (sec).
Table 1. Classification results of fine-tuned deep ResNet-18 features on augmented BUSI dataset.
Classifier | Time (sec) | FNR | Acc (%) | AUC | F1S | PREC (%) | SER (%) |
ESKNN | 22.08 | 1.64 | 98.3 | 0.99 | 98.34 | 98.33 | 98.36 |
Fine KNN | 21.139 | 1.8 | 98.2 | 0.98 | 98.2 | 98.2 | 98.2 |
CSVM | 16.49 | 2.5 | 97.4 | 1 | 97.44 | 97.4 | 97.5 |
MGSVM | 21.588 | 2.64 | 97.3 | 1 | 97.32 | 97.3 | 97.36 |
Weighted KNN | 18.697 | 2.94 | 97 | 1 | 96.99 | 96.93 | 97.06 |
WN2 | 11.443 | 3.14 | 96.8 | 0.99 | 96.86 | 96.86 | 96.86 |
QSVM | 15.459 | 3.2 | 96.7 | 0.99 | 96.76 | 96.73 | 96.8 |
MN2 | 8.3131 | 3.54 | 96.4 | 0.99 | 96.44 | 96.43 | 96.46 |
BiN2 | 22.556 | 3.54 | 96.4 | 0.98 | 96.44 | 96.43 | 96.46 |
TriN2 | 24.296 | 4 | 95.9 | 0.98 | 95.98 | 95.96 | 96 |
• Note: Bold denotes the best results.
• Abbreviations: BiN2, bilayered neural network; CSVM, cubic SVM; ESKNN, ensembled subspace KNN; MGSVM, medium Gaussian SVM; MN2, medium neural network; TriN2, trilayered neural network; WN2, wide neural network.
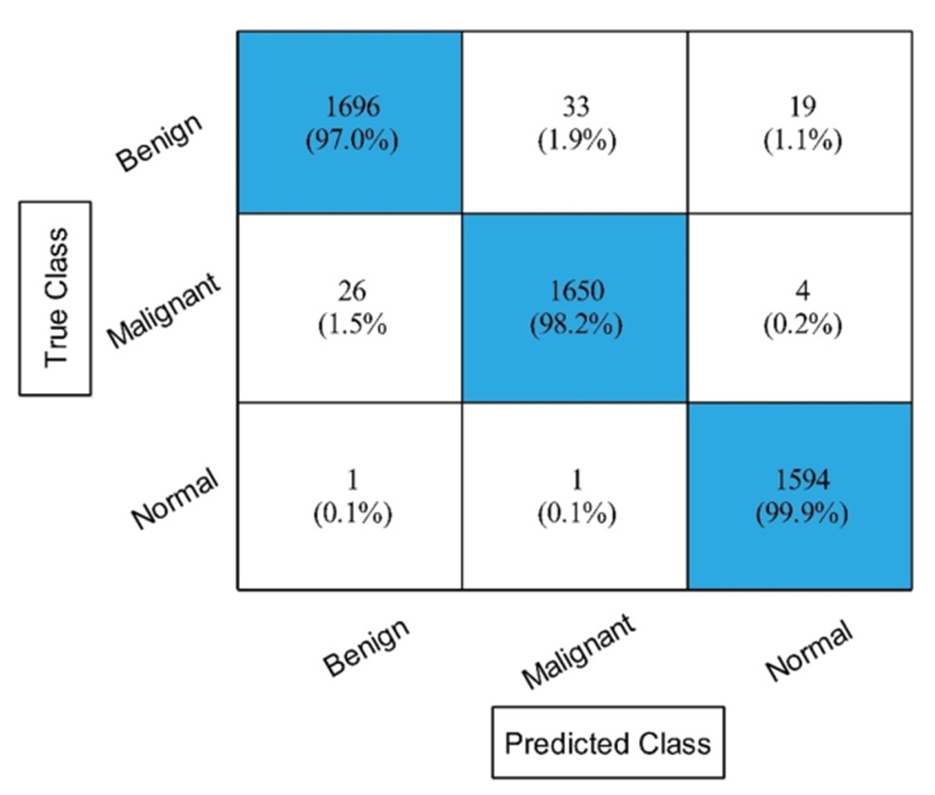
Figure 7. The confusion matrix of experiment 1 for ESKNN classifier. ESKNN, Ensembled Subspace KNN.
During the second trial, the methodology shifted to extracting and classifying features from an adjusted EfficientNet-b0 architecture. Table 2 documents the statistical outputs, highlighting the ESKNN classifier's leading accuracy of 97.6%. Accompanying metrics for ESKNN include a 97.63% SER, 97.6% PREC, 97.61% F1S, and a 2.37% FNR. The confusion matrix in Figure 8 corroborates these performance levels along its diagonal. The Fine KNN followed as the runner-up with 97.2% accuracy, whereas the Tri-layered NN logged the lowest score at 92.6%. Time efficiency tracking demonstrated that the medium NN completed its task the fastest, requiring 14.621 (sec). Overall, this second phase exhibited lower accuracy and heavier computational demands than the initial trial.
Table 2. Classification results of fine-tuned deep EfficientNet-b0 features on augmented BUSI dataset.
Classifier | Time (sec) | FNR | Acc (%) | AUC | F1S | PREC (%) | SER (%) |
ESKNN | 61.76 | 2.37 | 97.6 | 0.99 | 97.61 | 97.6 | 97.63 |
Fine KNN | 56.674 | 2.74 | 97.2 | 0.98 | 97.22 | 97.2 | 97.26 |
CSVM | 81.763 | 3.64 | 96.3 | 0.99 | 96.32 | 96.3 | 96.36 |
MGSVM | 121.85 | 4.5 | 95.5 | 0.99 | 95.89 | 96.3 | 95.5 |
Weighted KNN | 58.614 | 5.64 | 94.2 | 0.99 | 94.34 | 94.33 | 94.36 |
WN2 | 19.212 | 5.27 | 94.6 | 0.99 | 94.69 | 94.66 | 94.73 |
QSVM | 69.952 | 4.94 | 95 | 0.99 | 95.02 | 95 | 95.06 |
MN2 | 14.621 | 5.8 | 94.1 | 0.98 | 94.16 | 94.13 | 94.2 |
BiN2 | 42.235 | 7.3 | 92.6 | 0.96 | 92.68 | 92.66 | 92.7 |
TriN2 | 68.024 | 7.37 | 92.6 | 0.96 | 92.66 | 92.63 | 92.7 |
• Note: Bold denotes the best results.
• Abbreviations: BiN2, bilayered neural network; CSVM, cubic SVM; ESKNN, ensembled subspace KNN; MGSVM, medium Gaussian SVM; MN2, medium neural network; TriN2, trilayered neural network; WN2, wide neural network.
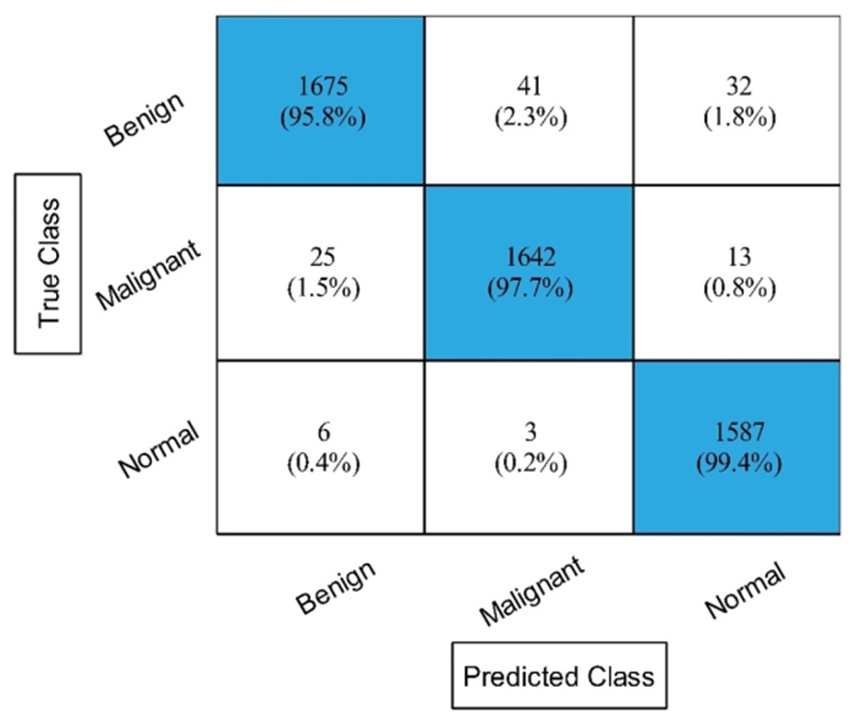
Figure 8. The confusion matrix of experiment 2 using ESKNN classifier. ESKNN, Ensembled Subspace KNN.
The third assessment incorporated an enhanced cuckoo search algorithm to isolate the most critical ResNet19 features prior to classification. The corresponding metrics are logged in Table 3. Once again, ESKNN outperformed the alternatives, securing an accuracy of 98%, alongside an SER of 98.06%, PREC of 98.06%, F1-Score of 98.06%, and FNR of 1.94%. Figure 9 displays the supporting confusion matrix. The Fine KNN model achieved a competitive 97.9% accuracy, while the Tri-layered NN bottomed out at 95%. Analyzing the execution durations revealed the medium NN as the swiftest at a mere 4.1722 (sec). This configuration successfully boosted accuracy while substantially trimming computational delays relative to the prior phase.
Table 3. Classification results of Resnet18 deep model after employing Cuckoo Search based best feature selection on augmented BUSI dataset.
Classifier | Time (sec) | FNR | Acc (%) | AUC | F1S | PREC (%) | SER (%) |
ESKNN | 9.641 | 1.94 | 98 | 0.99 | 98.06 | 98.06 | 98.06 |
Fine KNN | 9.8311 | 2.1 | 97.9 | 0.98 | 97.88 | 97.86 | 97.9 |
CSVM | 7.0433 | 2.74 | 97.2 | 1 | 97.24 | 97.23 | 97.26 |
MGSVM | 8.4764 | 3.07 | 96.9 | 0.99 | 96.91 | 96.9 | 96.93 |
Weighted KNN | 8.8949 | 3.54 | 96.4 | 0.99 | 96.42 | 96.4 | 96.46 |
WN2 | 9.8142 | 3.64 | 96.3 | 0.99 | 96.32 | 96.3 | 96.36 |
QSVM | 6.8105 | 3.84 | 96.1 | 0.99 | 96.14 | 96.13 | 96.16 |
MN2 | 4.1722 | 4.27 | 95.7 | 0.99 | 95.71 | 95.7 | 95.73 |
BiN2 | 12.458 | 4.5 | 95.4 | 0.98 | 95.46 | 95.43 | 95.5 |
TriN2 | 21.856 | 4.9 | 95 | 0.98 | 95.06 | 95.03 | 95.1 |
• Note: Bold denotes the best results.
• Abbreviations: BiN2, bilayered neural network; CSVM, cubic SVM; ESKNN, ensembled subspace KNN; MGSVM, medium Gaussian SVM; MN2, medium neural network; TriN2, trilayered neural network; WN2, wide neural network.
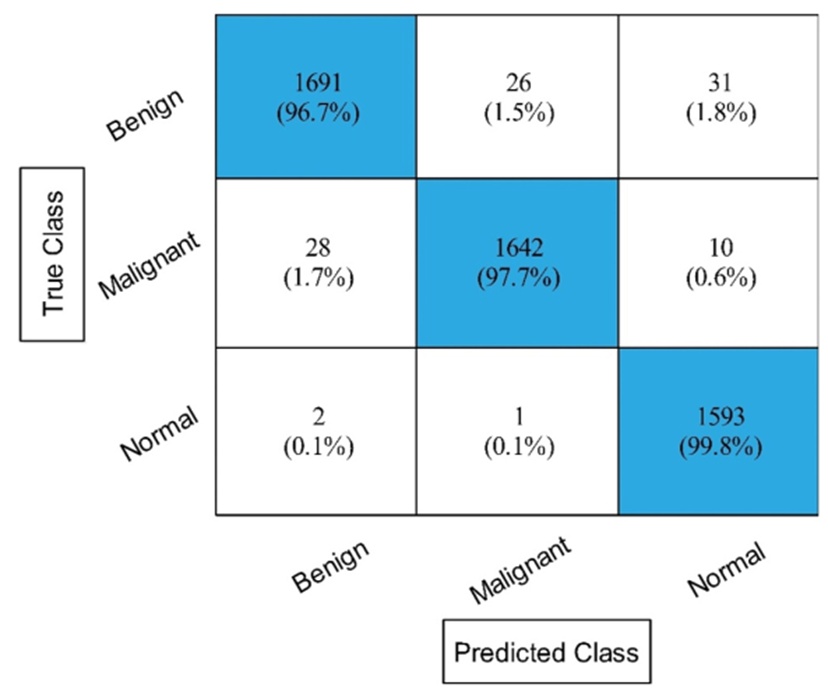
Figure 9. Experiment no 3 confusion matrix for ESKNN classifier. ESKNN, Ensembled Subspace KNN.
For the fourth evaluation, the refined cuckoo search algorithm was repurposed to filter features from the EfficientNet-b0 network before feeding them into the classifiers. The resulting data is available in Table 4. The ESKNN model peaked at 97.5% accuracy, generating an SER of 97.5%, a PREC of 97.43%, an F1-Score of 97.46%, and an FNR of 2.5%. The exact predictions are mapped along the diagonal of the confusion matrix in Figure 10. Fine KNN secured the second position with 97%, and the Tri-layered NN dropped to a minimum of 90.7%. Tracking execution speeds indicated the medium NN operated fastest at 9.0573 (sec). Although this setup experienced a marginal dip in accuracy compared to the third experiment, it maintained strong computational efficiency.
Table 4. Classification results of EfficientNet-b0 deep model after employing improved cuckoo search based best feature selection on augmented BUSI dataset.
Classifier | Time (sec) | FNR | Acc (%) | AUC | F1S | PREC (%) | SER (%) |
ESKNN | 25.96 | 2.5 | 97.5 | 0.99 | 97.46 | 97.43 | 97.5 |
Fine KNN | 25.824 | 2.94 | 97 | 0.98 | 97.04 | 97.03 | 97.06 |
CSVM | 30.524 | 4.54 | 95.4 | 0.99 | 95.42 | 95.4 | 95.46 |
MGSVM | 42.192 | 5.17 | 94.7 | 0.99 | 94.79 | 94.76 | 94.83 |
Weighted KNN | 25.314 | 5.84 | 94 | 0.99 | 94.10 | 94.06 | 94.16 |
WN2 | 12.171 | 6.2 | 93.7 | 0.98 | 93.78 | 93.76 | 93.8 |
QSVM | 34.042 | 6.2 | 93.7 | 0.99 | 93.74 | 93.7 | 93.8 |
MN2 | 9.0573 | 7 | 92.9 | 0.98 | 93 | 93 | 93 |
BiN2 | 33.134 | 9.1 | 90.8 | 0.95 | 90.88 | 90.86 | 90.9 |
TriN2 | 39.728 | 9.17 | 90.7 | 0.95 | 90.81 | 90.8 | 90.83 |
• Note: Bold denotes the best results.
• Abbreviations: BiN2, bilayered neural network; CSVM, cubic SVM; ESKNN, ensembled subspace KNN; MGSVM, medium Gaussian SVM; MN2, medium neural network; TriN2, trilayered neural network; WN2, wide neural network.
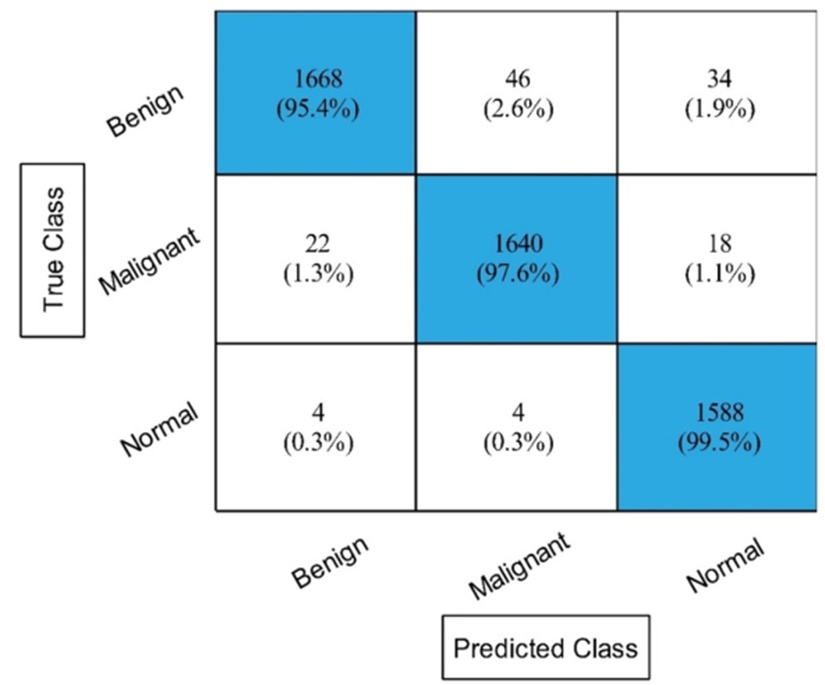
Figure 10. ESKNN classifier confusion matrix for experiment no 4. ESKNN, Ensembled Subspace KNN.
The fifth stage introduced a novel parallel zero-padding correlation coefficient method to merge the filtered features from both neural networks. Table 5 provides the evaluation data, showcasing an impressive 98.4% top accuracy by the ESKNN algorithm. This model also yielded an SER of 98.43%, PREC of 98.36%, F1-Score of 98.39%, and an FNR of 1.57%. Figure 11 confirms these results visually. The Fine KNN registered 97.7% accuracy, while the Bi-layered NN recorded the lowest at 96%. Speed tests highlighted the medium NN at 9.4891 (sec). While the fusion strategy successfully maximized the classification precision, it inadvertently introduced a computational penalty. To counter this delay, a subsequent feature selection pass was initiated to eliminate surplus data.
Table 5. Classification results of proposed parallel based zero-padding correlation coefficient feature fusion.
Classifier | Time (sec) | FNR | Acc (%) | AUC | F1S | PREC (%) | SER (%) |
ESKNN | 40.95 | 1.57 | 98.4 | 0.99 | 98.39 | 98.36 | 98.43 |
Fine KNN | 34.785 | 2.3 | 97.7 | 0.98 | 97.71 | 97.73 | 97.70 |
CSVM | 33.213 | 1.87 | 98.1 | 1 | 98.13 | 98.13 | 98.13 |
MGSVM | 49.666 | 2.0 | 97.9 | 1 | 97.94 | 97.90 | 98.00 |
Weighted KNN | 34.658 | 3.3 | 96.6 | 1 | 96.64 | 96.60 | 96.70 |
WN2 | 11.973 | 2.7 | 97.3 | 1 | 97.30 | 97.30 | 97.30 |
QSVM | 33.895 | 2.2 | 97.8 | 1 | 97.80 | 97.80 | 97.80 |
MN2 | 9.4891 | 2.9 | 97.1 | 1 | 97.08 | 97.06 | 97.10 |
BiN2 | 13.414 | 3.97 | 96 | 0.98 | 96.01 | 96.00 | 96.03 |
TriN2 | 25.693 | 3.84 | 96.1 | 0.99 | 96.14 | 96.13 | 96.16 |
• Note: Bold denotes the best results.
• Abbreviations: BiN2, bilayered neural network; CSVM, cubic SVM; ESKNN, ensembled subspace KNN; MGSVM, medium Gaussian SVM; MN2, medium neural network; TriN2, trilayered neural network; WN2, wide neural network.
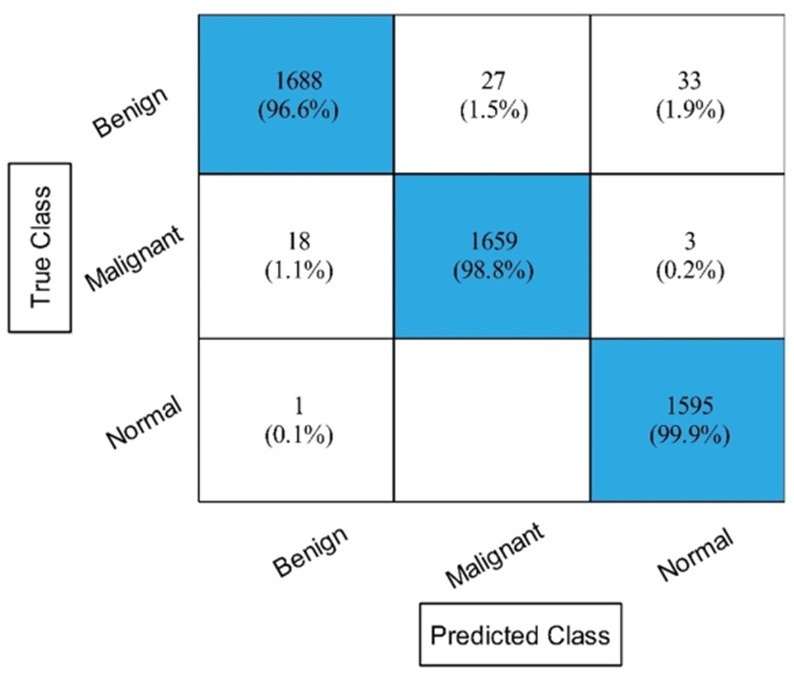
Figure 11. The confusion matrix of ESKNN after employing proposed feature fusion approach. ESKNN, Ensembled Subspace KNN.
To address the processing lag identified in the fifth phase, the optimized feature selection mechanism was reapplied to the fused dataset. Table 6 documents the post-selection outcomes. Under these conditions, the ESKNN algorithm stabilized at a 98% accuracy mark, accompanied by an SER of 98.06%, PREC of 97.96%, F1-Score of 98.01%, and an FNR of 1.94%. Figure 12 provides the corresponding confusion matrix. Post-selection time analysis showed the medium NN operating most swiftly at 4.9363 (sec). This concluding modification successfully slashed the execution duration while retaining high predictive reliability.
Table 6. Classification results of improved feature selection employing on fused feature vector.
Classifier | Time (sec) | FNR | Acc (%) | AUC | F1S | PREC (%) | SER (%) |
ESKNN | 17.83 | 1.94 | 98 | 0.99 | 98.01 | 97.96 | 98.06 |
Fine KNN | 17.059 | 2.64 | 97.3 | 0.98 | 97.32 | 97.3 | 97.36 |
CSVM | 16.472 | 2.67 | 97.3 | 1 | 97.33 | 97.33 | 97.33 |
MGSVM | 22.523 | 2.7 | 97.3 | 1 | 97.28 | 97.26 | 97.3 |
Weighted KNN | 17.716 | 3.64 | 96.2 | 1 | 96.29 | 96.23 | 96.36 |
WN2 | 7.3086 | 3.54 | 96.4 | 0.99 | 96.42 | 96.4 | 96.46 |
QSVM | 15.197 | 3.2 | 96.7 | 1 | 96.78 | 96.76 | 96.8 |
MN2 | 4.9363 | 4.04 | 95.9 | 0.99 | 95.92 | 95.9 | 95.96 |
BiN2 | 8.4681 | 5.37 | 94.6 | 0.97 | 94.59 | 94.56 | 94.63 |
TriN2 | 13.998 | 5.17 | 94.8 | 0.98 | 94.83 | 94.83 | 94.83 |
• Note: Bold denotes the best results.
• Abbreviations: BiN2, bilayered neural network; CSVM, cubic SVM; ESKNN, ensembled subspace KNN; MGSVM, medium Gaussian SVM; MN2, medium neural network; TriN2, trilayered neural network; WN2, wide neural network.
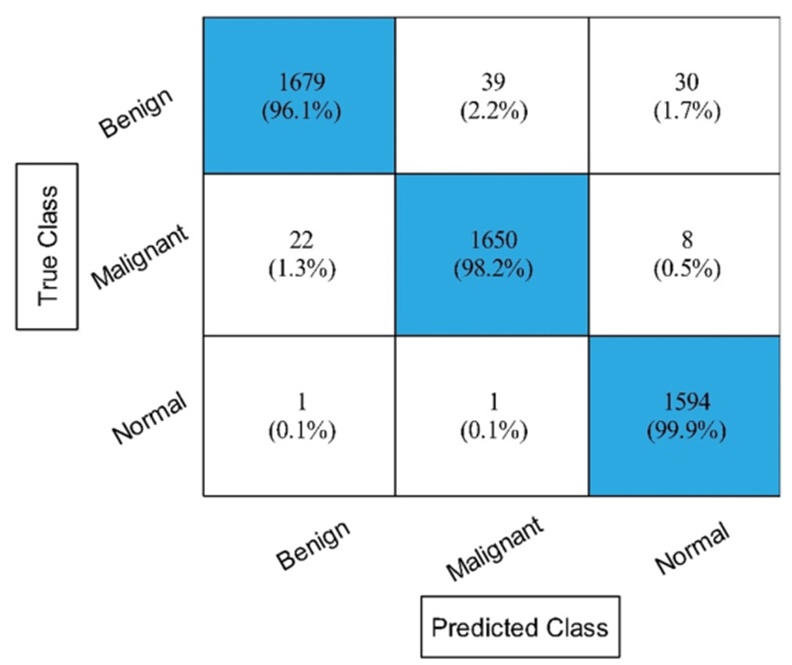
Figure 12. The confusion matrix of ESKNN after employing improved feature selection technique on the fused feature vector. ESKNN, Ensembled Subspace KNN.
This portion critically evaluates the study's outcomes. First, Grad-CAM visualization was employed to interpret the behavior of the pre-trained architectures. As demonstrated in Figure 13, the system processes original imagery through the pre-trained network and a Softmax classifier to generate preliminary predictions. Subsequently, Grad-CAM overlays a heatmap onto these results, illuminating the specific pixel clusters that most heavily influenced the model's decision-making process.
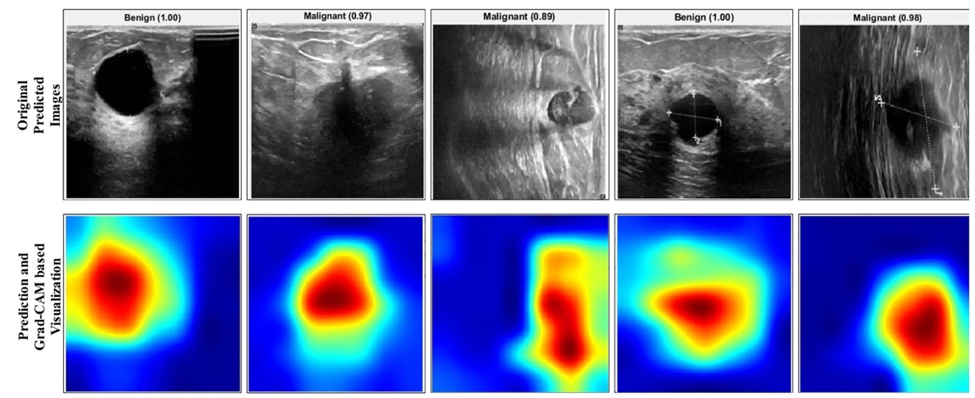
Figure 13. Labelled prediction and Grad-CAM based visualisation of important region.
Next, the computational efficiency of the framework's intermediate phases was analyzed. Figure 14 charts the execution delays across these varying stages. The graph reveals that the foundational deep learning configurations (E-B0 and R-18) were quite computationally heavy. Introducing the optimization algorithm successfully slashed this processing time by roughly half. To prevent a subsequent drop in predictive power, feature fusion was integrated prior to optimization. Ultimately, this combined strategy ensured rapid processing while maintaining accuracy levels that rival contemporary literature.
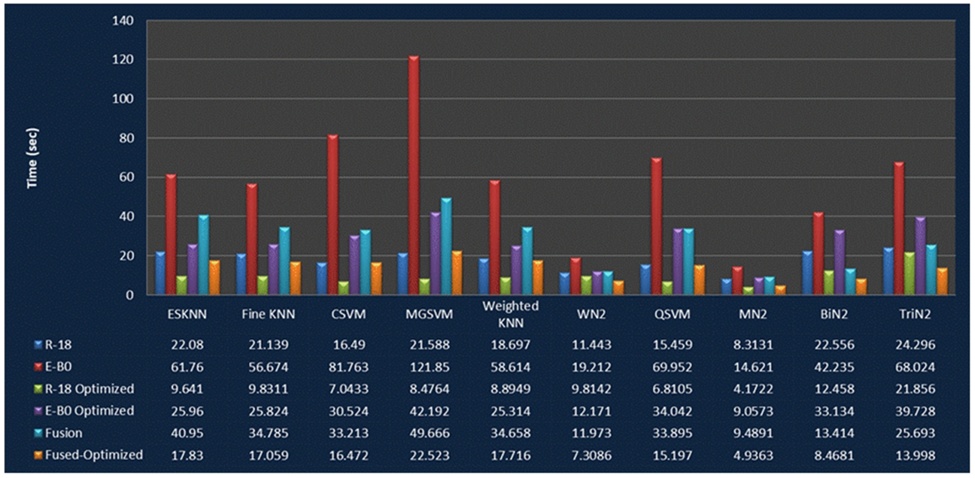
Figure 14. Comparison of the proposed framework middle steps based on computation time. *R-18 denotes modified ResNet-18 model, E-B0 denotes the modified EfficientNet-B0 model with GRU module. GRU, Gated Recurrent Unit.
Finally, the overall efficacy of the introduced system was benchmarked against existing models. Table 7 details this comparative analysis, confirming that the current architecture surpasses previous methodologies in accuracy. The core advantage of this research is its capacity to deliver superior diagnostic precision rapidly, a feat made possible by compressing vital data through targeted feature optimization.
Table 7. Comparison with recent techniques for the proposed framework.
Reference | Year | Dataset | Accuracy (%) |
2022 | BUSI | 96.24 | |
2022 | BUSI | 94.5 | |
2022 | BUSI | 97.18 | |
2022 | BUSI | 94.8 | |
2022 | BUSI | 74.5 | |
2022 | BUSI | 95.81 | |
Proposed | 2023 | BUSI | 98 |
• Note: Bold denotes the best results.
• Abbreviation: BUSI, breast ultrasound imaging dataset.
This paper presents an advanced architecture for identifying breast cancer in BUS imagery, utilizing Grad-CAM interpretation and optimized deep learning feature fusion. The designed pipeline achieves highly accurate lesion categorization with minimal delay. To prevent overfitting and expand the dataset's variance, data augmentation was applied prior to network training. The chosen neural networks were upgraded via the integration of multi-head self-attention mechanisms and GRU units. Following deep transfer learning, the models underwent Grad-CAM visual scrutiny. Because the standalone accuracy of these modified models was lacking, a refined feature selection protocol was instituted, yielding noticeable gains. To push the boundaries of this accuracy further, a novel feature fusion method was integrated. While successful in boosting precision, this fusion inflated processing requirements, necessitating a final round of feature selection to trim execution delays. Tested on the open-access BUSI database, the finalized framework successfully achieved an impressive 98% accuracy rate.
Despite the system's dual benefits of high precision and rapid execution, a few constraints must be acknowledged. First, the reliance on constrained or mixed-scale datasets can suppress diagnostic accuracy. Second, the aggressive filtering during feature selection might unintentionally discard variables beneficial for robust classification and precise weight mapping. Subsequent research will focus on deploying broader, more varied datasets to counteract class imbalances. Additionally, future efforts will explore the development of an agile, multi-scale architecture to further optimize breast cancer classification.
This work is supported by the Princess Nourah bint Abdulrahman University Researchers Supporting Project number (PNURSP2024R506), the Princess Nourah bint Abdulrahman University, Riyadh, Saudi Arabia.
None
None
None
Open Access The author(s) retain copyright. This article is licensed under the Creative Commons Attribution-NonCommercial-ShareAlike 4.0 International License. It may be shared and adapted for non-commercial purposes with appropriate attribution, an indication of changes, and distribution of adaptations under the same license. Third-party material may be subject to separate terms identified in its credit line. View the license at https://creativecommons.org/licenses/by-nc-sa/4.0/.
 Transparent Intelligence Publishing