Anticipating the movement of nearby traffic participants allows automated vehicles to formulate safe and efficient navigation strategies. This undertaking is highly intricate, given that the conduct of road users is shaped by numerous variables, resulting in a substantial variety of potential future paths (multi-modality). The majority of previous methodologies designed to tackle multi-modal trajectory forecasting rely on intricate machine learning architectures that offer minimal interpretability. Furthermore, the performance measures utilized in contemporary benchmarks fail to assess every dimension of the issue, particularly regarding the variety and validity of the generated paths.
The authors intend to progress the creation of dependable trajectory forecasting systems by aligning with specific tenets established for Trustworthy Artificial Intelligence. The primary emphasis is directed toward assessment benchmarks, structural resilience, and the explainability of model outputs. Initially, existing appraisal metrics undergo a detailed examination to pinpoint the major deficiencies in current benchmarks, leading to the introduction of a new, comprehensive assessment framework. Following this, a methodology to evaluate spatial and temporal resilience is developed by replicating sensor noise within the perception pipeline. To improve output interpretability and produce more equitable outcomes across the proposed evaluation metrics, an intention forecasting layer is introduced that can be integrated into existing multi-modal trajectory models. The utility of this configuration is analyzed via a user study that investigates distinct graphical representations of multi-modal paths and driver intents. The introduced methodology and subsequent insights offer a meaningful advancement toward constructing dependable trajectory forecasting frameworks for automated vehicles, shifting the discipline toward elevated levels of safety and operational dependability.
The capacity of human operators to anticipate the actions of surrounding traffic participants enables us to foresee prospective hazards and execute mitigating maneuvers to reduce safety threats. This capability likewise permits humans to execute smoother and more comfortable driving adjustments. Consequently, it is vital for autonomous vehicles to possess the capacity to anticipate the movements of other road users, allowing them to implement predictive guidance algorithms and mimic human-like driving behavior.
Nonetheless, forecasting the upcoming actions and pathways of traffic entities represents a highly convoluted problem, since road user behavior is shaped by a multitude of distinct variables and mutual dynamics [1, 2]. Moreover, even though driving environments are highly organized (e.g., roadway geometry, driving regulations), the quantity of potential future paths branching from a single historical trajectory can be substantial for any given actor, whether they are pedestrians, cyclists, or automobiles. This demonstrates that the underlying problem is fundamentally multi-modal.
To manage this intricate environment, the majority of computational strategies designed for multi-modal trajectory forecasting depend on highly sophisticated machine learning structures that are far from transparent. These frameworks operate beyond human cognitive scales and are characterized by opacity (i.e., black-box architectures). Furthermore, a unified consensus regarding the most critical metrics for performance evaluation is still lacking. Distinct validation platforms advocate for different metrics and predominantly emphasize precision, while disregarding other crucial dimensions such as resilience, output variety, or adherence to legal driving boundaries.
Additionally, recent years have seen a growing consensus that the formulation of intricate, learning-based architectures must conform to specific guidelines to guarantee compliance with both traditional safety principles and broader ethical frameworks. This paradigm has recently been classified under the umbrella of Trustworthy AI. This concept integrates various ethical tenets, operational needs, and benchmarks to ensure that AI frameworks are structured around human-centric methodologies and dedicated to societal benefit [3]. The creation of human-focused AI has become a widespread global movement. For instance, within the EU, the High-Level Expert Group on AI (AI HLEG) established by the European Commission (EC) outlined the fundamental horizontal prerequisites [4] and guidelines [5] for engineering trustworthy AI architectures, highlighting factors such as human oversight, structural resilience and safety, data confidentiality and governance, transparency, impartiality, societal well-being, and traceability.
In April 2021, the EC introduced the Proposal for a regulation laying down harmonised rules on AI (the AI Act [6]), which mandates specific conditions for AI models deployed in high-risk environments. Among these stipulations, the AI Act dictates that relevant precision metrics must be appropriate for their intended function, and that technological steps must be implemented to streamline the interpretability of AI system behaviors. In the US context, though framed with a different terminology ('algorithms' and 'automated decision systems' rather than 'AI systems', and 'critical decisions' instead of 'high-risk scenarios'), the Algorithmic Accountability Act [7] was brought before the US Senate and the House of Representatives in February 2022, similarly demanding explicit standards for impact studies, system documentation, and performance validation of automated critical decision setups.
Through this research, we seek to advance the engineering of trustworthy multi-modal motion forecasting architectures by addressing several of the aforementioned standards. Specifically, our focus centers on appraisal benchmarks, including environmental resilience, alongside output interpretability. The primary contributions of this study can be outlined as follows (Figure 1):
We perform a thorough analysis of existing evaluation metrics, highlighting major shortcomings and introducing a novel, comprehensive appraisal framework that simultaneously accounts for accuracy, path diversity, and compliance with driving regulations (admissibility).
We establish a new methodology to measure the spatial and temporal resilience of multi-modal trajectory forecasting by replicating noise characteristics inside the perception framework.
We introduce an intention forecasting layer capable of being integrated into multi-modal path prediction models to upgrade output interpretability and yield more balanced metrics within our comprehensive evaluation framework.
We validate both output explainability and the appraisal framework using a user survey that investigates various graphical elements in the representation of multi-modal trajectories and driver motivations.
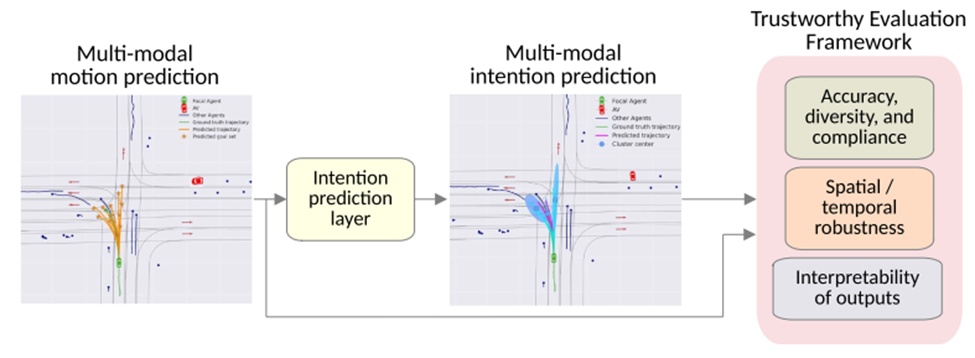
Figure 1. Towards trustworthy multi-modal motion prediction. The intention prediction layer enhances the interpretability of the results. The proposed evaluation framework includes a holistic set of metrics and a robustness analysis.
The presented investigation is executed using two of the most widely adopted data repositories in this domain (Argoverse [8] and nuScenes [9]), utilizing two prominent multi-modal forecasting models (DenseTNT [10] and PGP [11]).
In recent times, an array of differing strategies has been introduced to manage multi-modal trajectory forecasting [12-17]. Leading contemporary approaches utilize graph-based structures [10, 11, 18-20], given that traffic environments naturally lend themselves to graph representations. Graph networks offer flexibility and efficiency because they facilitate the direct and explicit modeling of actor dynamics via network edges. Frequently, graph-centric systems map the attributes of agents (e.g., motor vehicles, pedestrians, cyclists) onto vertices, while mapping the inter-agent dynamics onto edges [20]. Multiple architectural design selections must be determined to properly structure input variables, represent localized interactions, and ultimately formulate output path distributions.
Trajectory forecasting strategies must properly capture both spatial geometry (stationary environment features) and traffic participants (changing environment features). The conventional rasterized format maps the environment as a collection of bird's-eye-view (BEV) images, frequently designated as high-definition (HD) maps [12, 13, 21, 22]. This strategy is intuitive since all diverse input categories (e.g., lane configurations, historical states of actors, and spatial arrangements) are aggregated into a multi-channel image representation, enabling the deployment of a Convolutional Neural Network (CNN). Nonetheless, this methodology is constrained by the restricted receptive fields inherent to standard CNN frameworks. Consequently, rasterized setups struggle to model long-range interactions effectively.
As an alternative, a more computationally economical graph-centric format can be implemented using polylines (e.g., traffic lanes, pedestrian crossings, and driving boundaries) that denote piecewise linear paths [10, 16, 18, 19, 23, 24]. Within this format, long-distance dependencies are modeled both effectively and efficiently. As an illustration, VectorNet [10, 18, 19] structures lane segments and historical actor states as interconnected sequential vectors. To build upon this, the Lane-based Trajectory Prediction (LTP) approach [23] structures the map using interconnected, partitioned lane elements to capture driver intentions with higher precision. Other methodologies [11, 25-27] generate a complementary lane graph, taking advantage of the temporal and spatial alignments found within the vector-based contextual scene.
Two distinct forms of interaction require modeling within these architectures. The first involves the encoding of sequential temporal data, which is commonly achieved through Recurrent Neural Networks (RNNs)—such as the Gated Recurrent Unit (GRU) [28] or Long Short-Term Memory (LSTM) [29] networks—or via temporal convolutions. The second addresses the dynamics between relevant road agents and their surrounding environment, which is typically modeled using an attention mechanism [30]. The approach chosen for interaction modeling is intimately tied to the method utilized for scene encoding.
Operating on a polyline-based architecture, VectorNet [10, 18, 19] leverages self-attention modules exclusively to directly learn the relationships among all environmental sub-graphs. Furthermore, goal-oriented lane attention [31] highlights the specific connections between road actors and traffic lanes. The split-joint attention mechanism employed by LaneGCN [26] is designed to capture the intricate topology of lane graphs alongside long-range dependencies. Deo et al. [11] introduce the Prediction via Graph-based Policy (PGP) framework, in which interaction modeling is structured around lane-graph traversals. This strategy merges discrete policy roll-outs with a lane-graph subset decoder, effectively conditioning each trajectory prediction on the goals of the driver. Ultimately, the network outputs trajectory predictions by selectively attending to node encodings along the paths mapped out by the policy and a sampled latent variable.
To properly account for environmental uncertainty, models designed for future trajectory forecasting must be capable of generating multi-modal paths [21, 31, 32]. This capability can be established either by implicitly framing multi-modality through latent variables or by explicitly generating an array of distinct trajectory proposals. The former strategy utilizes Gaussian Mixture Models (GMMs) [33] or Mixture Density Networks (MDNs) [34] to construct probability distributions over potential paths. In the subsequent phase, it employs Variational Autoencoders (VAEs), or more recently their modified variants as Conditional Variational Autoencoders (CVAEs) [35], or Generative Adversarial Networks (GANs) [33, 36, 37] to sample varied future modes from the latent space. The primary limitation of this implicit methodology is that the resulting predictions lack straightforward, unambiguous interpretability, which diminishes the clarity of the model's outputs.
Conversely, proposal-based methodologies construct a variety of potential path candidates, thereby decoupling the task of intention prediction from actual motion forecasting. Certain techniques [10, 19] sample candidate proposal points surrounding the lane centerlines to capture highly granular details. This sampling process relies on hand-crafted rules, which include restrictions preventing different agents from sharing identical proposals. In contrast, the approach in [23] extracts lane segments directly from the map to serve as proposals, which can explicitly represent the fine-grained intentions of agents while being shared across a global context.
From the pool of generated paths, the most dependable trajectories must be isolated. To achieve this, variants of the Non-maximum Suppression (NMS) algorithm are widely implemented. The conventional formulation of this method is utilized in TNT [19], where trajectories are ranked based on the model's scoring mechanism. Following this, the geometric distance between different paths is evaluated to isolate a diverse selection of high-scoring trajectories. Similarly to TNT, LaneRCNN [27] treats an individual lane segment as a spatial anchor, outputs a probability value for each anchor, and applies NMS to eliminate redundant target goals that are located too close together. This strategy has limitations, as relying on a rigid threshold prevents the system from balancing prediction accuracy against the multi-modality of the final output. To address this, DenseTNT [10] introduces an anchor-free, goal-driven model that produces a collection of predicted destinations without depending on heuristic anchor setups.
The evaluations detailed in the following sections are performed using two publicly accessible trajectory forecasting benchmarks: The Argoverse v1.1 Motion Forecasting Dataset [8] and nuScenes [9]. These two repositories stand as the most widely adopted benchmarks within the motion forecasting community. The datasets exhibit variations across several parameters, including the total number of driving scenes, aggregate recording hours, number of tracked entities, behavioral complexity, and the target prediction time horizon. The prediction time horizon, in particular, represents a critical factor. Long-term trajectory forecasting is inherently more challenging, and multi-modal prediction frameworks generally demonstrate higher efficacy under these conditions. Accurately deciphering a driver's underlying intent and the subsequent path of a vehicle is fundamental to safe motion planning. This accuracy is heavily contingent on the comprehensive quality of the data used to train the underlying algorithms, highlighting the necessity of choosing suitable data sources for deployment applications.
Argoverse [8], introduced in 2019 by Argo AI, comprises 323,557 real-world driving episodes. These driving scenarios were captured across two American metropolitan areas: Miami and Pittsburgh. Each recorded instance encompasses 2 s of historical actor states followed by 3 s of ground-truth future states, recorded at a sampling frequency of 10 Hz. The complete dataset encompasses roughly 320 hours of driving. Within each scene, a specific agent of interest is designated as the target for future motion prediction. For training and validation purposes, the dataset provides the history of the focal agent, positional tracks of neighboring (social) actors, and high-definition (HD) map information. The accompanying semantic HD map uses a streamlined format composed of lane-based polylines.
nuScenes [9], introduced in 2020 by Motional, represents a large-scale data repository for multi-agent trajectory prediction containing 1,000 distinct scenes recorded across Boston and Singapore, which feature right-hand and left-hand traffic configurations, respectively. Every scene is annotated at a frequency of 2 Hz and spans a duration of 20 s. The dataset incorporates up to 23 semantic object categories, encompassing vehicles, bicycles, and pedestrians as trackable agents, alongside semantic HD maps containing 11 distinct annotated vector layers. Within this benchmark, every agent possesses 2 s of historical tracking data, and the future prediction horizon is designated as 6 s.
On the whole, Argoverse—which tends to capture brief, isolated driving sequences—is over 50 times larger than nuScenes in terms of total recording duration. Despite the substantial scale of the Argoverse repository, prior studies have highlighted that the compiled trajectories predominantly consist of straight-line movements throughout the entire 5 s observation window [24, 38]. This structural characteristic renders the benchmark considerably less demanding and diverse than nuScenes. The benchmarks also differ regarding the structural formulation of their HD maps. Argoverse provides a highly streamlined representation, whereas nuScenes delivers a more exhaustive yet complex map framework. For the purposes of this investigation, we simplified the nuScenes map definitions to isolate the most critical information required for our analysis.
This section revises the validation protocols typically applied to multi-modal trajectory prediction methodologies. The reviewed metrics are organized into distinct categories covering measures of precision, diversity, and admissibility (Table 1). Diversity characterizes the extent to which the generated output distribution covers the space of possible futures. The objective is to achieve structural diversity across the distinct modes of the distribution, rather than producing a collection of redundant trajectory candidates that correspond to a single underlying intent (mode). Concurrently, it is essential to measure the admissibility of these predictions, ensuring that they conform strictly to established traffic regulations.
Table 1. Reviewed metrics categorised in terms of accuracy, diversity, and admissibility. p corresponds to the probability of the best forecasted trajectory. Symbol - refers to no units, # refers to number of.
Category | Subcategory | Evaluation Metric | Unit | Rephrased Description |
Accuracy | Deterministic Metrics | Minimum Average Displacement Error (minADE) | m (↓) | Mean pointwise L2 distance between the ground-truth trajectory and the predicted trajectory, computed over the k highest-probability predictions. |
Minimum Final Displacement Error (minFDE) | m (↓) | L2 distance between the predicted final position and the actual final position, evaluated across the k most probable trajectory predictions. | ||
Miss Rate (MR) | % (↓) | Proportion of cases where none of an agent’s predicted trajectories end within 2.0 m of the true endpoint according to endpoint error. | ||
Heading Error | rad (↓) | Angular difference between the final heading of the predicted trajectory and that of the ground-truth trajectory. | ||
Mean Average Precision (mAP) | – (↑) | Area under the precision–recall curve obtained by varying confidence thresholds over the validation dataset. True and false positives follow the MR criterion, and only the highest-confidence prediction can be counted as a true positive for each agent. | ||
Soft Mean Average Precision (Soft mAP) | – (↑) | Variant of mAP in which additional correctly matched predictions beyond the highest-confidence one are not penalized. | ||
Scene-Level Metrics | Scene minADE | m (↓) | Joint minimum L2 error between predicted and actual trajectories considering all agents within a scene. | |
Scene minFDE | m (↓) | Joint minimum L2 distance between the K predicted endpoints and the true endpoint at the prediction horizon across all scene trajectories. | ||
Probabilistic Metrics | p-minADE | m (↓) | Extension of minADE that adds min(−log(p), −log(0.05)) to the average L2 trajectory error. | |
p-minFDE | m (↓) | Extension of minFDE that adds min(−log(p), −log(0.05)) to the endpoint L2 error. | ||
p-MR | % (↓) | Probabilistic version of Miss Rate where (1.0 − p) contributes instead of 0.0 when the best predicted endpoint lies within 2.0 m of the ground truth. | ||
Brier-minADE | m (↓) | Similar to minFDE, but includes an additional penalty term of (1.0 − p)² added to the endpoint L2 error. | ||
Brier-minFDE | m (↓) | Similar to minADE, but incorporates a penalty term of (1.0 − p)² into the average L2 trajectory error. | ||
Negative Log Likelihood (NLL) | – (↓) | Mean negative log-likelihood of the ground-truth trajectory estimated using kernel density estimation over predicted samples at corresponding prediction timesteps. | ||
Diversity | Ratio of avgFDE to minFDE (RF) | m/m (↑) | Ratio between avgFDE and minFDE, used to quantify the dispersion of predicted trajectories in Euclidean space. | |
Lateral Diversity | # Lanes Reached | # (↑) | Average count of distinct lanes that the predicted trajectories reach. | |
Final Heading Variance | rad² (↑) | Variance of the final heading angles among different prediction modes. | ||
LaneFDE | m (↓) | Smallest L2 distance between lane-centerline candidates and each predicted trajectory mode. | ||
Longitudinal Diversity | Speed Variance | m/s² (↑) | Variability of average speeds across predicted trajectories. | |
Acceleration Variance | m/s² (↑) | Variability of average accelerations across predicted trajectories. | ||
Admissibility | Drivable Area | Off-road Rate | % (↓) | Percentage of trajectories that leave the designated drivable region. |
Drivable Area Occupancy (DAO) | # (↑) | Fraction of drivable-area pixels occupied by the predicted trajectories. | ||
Drivable Area Compliance (DAC) | # (↑) | For a model generating n trajectories, where m leave the drivable area, DAC is calculated as (n − m)/n. | ||
Social Interactions | Scene Consistency Rate (SCR) | % (↓) | Percentage of predicted samples exhibiting overlap within a scene, measured using the IoU of future BEV bounding boxes for agent pairs. | |
Overlap Rate | % (↓) | Number of trajectory overlaps divided by the total number of agents. An overlap occurs if a predicted trajectory intersects with that of another agent at any prediction timestep. | ||
Traffic Rules | Oncoming Traffic Direction (OTD) | % (↓) | Percentage of predicted modes that travel against the designated traffic direction. |
Best-of-K Average Displacement Error (minADE): The lowest point-wise L2 distance to the ground-truth path computed across all generated trajectory predictions.
Scene minADE: Employed when evaluating the simultaneous trajectory forecasting of multiple road users. It quantifies the collective minimum L2 distance between the predicted paths and ground-truth trajectories across all tracked entities within the scene.
Best-of-K Final Displacement Error (minFDE): The lowest L2 distance between the K predicted endpoints and the actual ground-truth endpoint measured at the final prediction horizon across all generated paths.
Scene minFDE: Corresponding structurally to the scene minADE, this measure determines the collective minimum FDE across the entire driving environment.
Best-of-K Miss Rate (MR): The proportion of path predictions where the maximum point-wise L2 deviation between the forecast and the ground truth exceeds a specified limit. For both the Argoverse and nuScenes reference benchmarks, a boundary of 2.0 m is implemented. Nonetheless, they formulate this performance measure differently. While the nuScenes platform adheres to the aforementioned definition, Argoverse calculates MR based on the proportion of scenarios where no predicted trajectory terminates within 2 m of the actual ground-truth endpoint. Waymo [39] distinguishes between separate lateral and longitudinal boundaries, which are scaled according to the upcoming time horizon and the initial velocity.
Heading error: The angular variation between the heading of the predicted path and the ground-truth trajectory at the terminal point.
Mean Average Precision (mAP) [39]: The area beneath the precision-recall curve, derived by implementing varying confidence score thresholds across an evaluation dataset. This approach adopts the identical definition of an incorrect prediction as specified for MR, treating any missed trajectory as a false positive. Only a single true positive is permitted for each scenario, which is allocated to the forecast possessing the highest confidence score. The final mAP is reported as an average across eight distinct semantic categories or driving maneuvers: straight, straight-left, straight-right, left, right, left u-turn, right u-turn, and stationary. This strategy yields a more equitable appraisal, given that certain path shapes occur substantially less frequently than others.
Soft Mean Average Precision (Soft mAP) [39]: Analogous to mAP, except that additional matching forecasts beyond the one with the maximum confidence score are not penalized.
Multi-modal forecasting frameworks are commonly appraised utilizing Best-of-K metrics. These performance measures, while practical for deterministic regression systems, isolate merely a single output out of an arbitrary quantity K, thereby capturing only a restricted segment of the model's overall output distribution. Consequently, they are incapable of comparing the full probability distributions generated by multi-modal architectures, neglecting the appraisal of variance and multi-modality.
Furthermore, these metrics evaluate solely the quality of the independent marginal distribution for each separate agent. Best-of-K ADE selects the specific path sample that is geometrically closest to the ground truth of each individual actor independently. Consequently, this approach fails to gauge scene consistency among the joint predictions. It is feasible to achieve a minimal minADE by generating high-entropy distributions that lack structural consistency at the scene level. In [40], the authors introduce scene-level sample benchmarks to analyze how accurately the generated output modes capture the joint distribution of upcoming movements.
To achieve an equitable appraisal of a system's probabilistic performance, it is necessary to quantify its capacity to capture the underlying uncertainty distribution of upcoming movements. In the following, we outline several metrics implemented in existing literature [8] to validate probabilistic forecasting models, where p signifies the probability assigned to the optimal predicted path:
Probabilistic minimum Final Displacement Error (p-minFDE): Analogous to minFDE, this metric appends min(-log p, -log 0.05) to the terminal endpoint L2 distance.
Probabilistic minimum Average Displacement Error (p-minADE): Analogous to minADE, this metric appends min(-log p, -log 0.05) to the average point-wise L2 distance.
Probabilistic Miss Rate (p-MR): Analogous to Miss Rate, this formulation integrates 1.0 - p as the metric penalty instead of 0.0 when the maximum point-wise L2 variation between the forecast and the ground truth exceeds the specified limit.
Brier minimum Final Displacement Error (brier-minFDE) [41]: This measure corresponds to minFDE, with the addition of (1.0 - p) 2 to the terminal endpoint L_2 distance.
Brier minimum Average Displacement Error (brier-minADE) [41]: This measure corresponds to minADE, with the addition of (1.0 - p) 2 to the average point-wise L_2 distance.
Negative Log Likelihood (NLL) [42]: The mean negative log likelihood of the ground-truth path, computed via a kernel density estimation over the generated output samples at corresponding prediction time intervals.
It is essential to highlight that distinct benchmarks incorporate a varying quantity of modes when assessing prediction precision. For example, Argoverse and Waymo examine the 6 most probable trajectories, whereas nuScenes evaluates 5 and 10 modes. Regarding probability-centered metrics in Argoverse, the 6 most probable paths are isolated, and their corresponding probabilities are normalized prior to executing the metric calculations.
Variations also exist concerning the target prediction horizons. Both Argoverse and nuScenes deliver 2 s of historical trajectory data. Nonetheless, the Argoverse forecast time horizon spans 3 s, whereas nuScenes evaluates across a 6 s window. Waymo [39] furnishes positional tracks for the preceding 1 s and utilizes three separate validation intervals: 3, 5, and 8 s into the future.
Furthermore, no unified consensus exists regarding the primary metric used to arrange benchmark leaderboards. The nuScenes platform categorizes different methodologies according to minADE_5 (K = 5). Conversely, Argoverse organizes entries based on brier\text{-}minFDE at K = 6, prescribing a uniform probability distribution for algorithms that do not output discrete confidence values alongside their trajectory forecasts. In earlier iterations of the competition, they utilized MR and minFDE at K = 6. The Waymo leaderboard sorting is structured around the average Soft\ mAP across the designated evaluation intervals, utilizing MR as a secondary performance indicator.
Assessing the diversity of multiple generated trajectories is essential for a thorough validation of multi-modal forecasting capabilities. Nonetheless, this specific area of evaluation remains significantly less investigated in existing research, which frequently leads to models that deliver high accuracy scores but suffer from mode collapse and fail to exhibit genuine multi-modality. The primary metrics employed to quantify prediction diversity are detailed below:
Lateral diversity metrics: In [11], the authors introduce the mean count of distinct lanes attained as a metric for lateral variety, along with the variance observed in the final headings across different predicted modes. Furthermore, [38] introduces minLaneFDE, an index that characterizes both the volume and the caliber of multi-output diversity by leveraging reference lane centerlines. This metric calculates the minimal L2 distance between the centerlines of viable candidate lanes and each individual forecasted trajectory mode.
Longitudinal diversity metrics: The work in [11] utilizes the variance of the mean velocities and accelerations across the various predicted modes to capture longitudinal dispersion.
Ratio of avgFDE to minFDE (RF): Introduced in [43], this metric quantifies the spatial dispersion of generated trajectories using Euclidean distance.
A elevated average L2 error signifies that the generated trajectories are widely scattered, whereas a minimized lowest L2 error indicates that at least one forecasted mode possesses high accuracy. Guided by this principle, the authors of [43] suggest calculating the ratio of avgFDE to minFDE to reflect output diversity. However, this particular metric can fail to differentiate between longitudinal and lateral variations in certain driving contexts. Moreover, this index may artificially favor models with inferior accuracy and feasibility if the majority of their generated modes represent failed trajectories. A direct approach to quantifying lateral variation involves calculating the variance of the final heading angle across the K generated outputs. When map data is accessible, tracking the average number of final lanes reached serves as a reliable proxy for mode diversity. Conversely, longitudinal variation can be effectively captured by evaluating the variance of the final velocity and acceleration across the K outputs.
Crucially, validating how well predictions adhere to the constraints of the driving environment is vital for determining output quality and ensuring secure motion planning within intricate road scenes. The metrics utilized to gauge prediction feasibility include:
Off-road rate: Determines the proportion of generated trajectories that drift off-road or move outside the designated drivable zones.
Drivable Area Occupancy (DAO) [43]: Quantifies the percentage of pixels within the drivable region that are intersected by the forecasted paths. This metric is frequently combined with RF to achieve a more realistic assessment of diversity.
Drivable Area Compliance (DAC) [8]: Evaluates extreme, non-admissible off-road predictions. If a forecasting model generates K future trajectory modes, and M of these modes exit the drivable region at any point in time, the DAC score for the model is formulated as (N − M)/N.
Scene consistency rate (SCR) [40]: Computes the percentage of generated samples that exhibit spatial overlap or collisions within the environment to evaluate social compliance. Collisions are identified by establishing a low Intersection over Union (IOU) threshold and comparing the future Bird's-Eye-View (BEV) bounding boxes for every pair of traffic agents.
Overlap Rate [39]: Comparable to the SCR metric, this approach extracts the highest-confidence prediction for each traffic participant and determines the total count of overlaps divided by the overall number of agents. A single overlap event is recorded if any part of these trajectories intersects with another agent at any point during the forecasting horizon.
The off-road rate, DAO, and DAC are highly effective for determining the fraction of modes that breach boundary constraints, while the final two metrics assess a model's capacity to account for multi-agent social interactions. Nonetheless, to the best of our knowledge, current literature lacks metrics designed to evaluate adherence to traffic regulations. To address this gap, we introduce a metric to calculate the proportion of modes that travel against the designated flow of traffic, defined as OTD = .
Autonomous driving represents a high-stakes, safety-critical domain. Consequently, it is vital to rigorously analyze each underlying component, particularly the trajectory forecasting module, which delivers critical inputs for secure and efficient motion planning. A thorough validation and diagnosis of a prediction model's performance must look beyond basic accuracy to encompass both diversity and feasibility. Examining these distinct dimensions simultaneously yields a comprehensive evaluation framework for multi-modal trajectory forecasting. In practical deployment, the selection of specific validation metrics will depend on the unique constraints of the vehicle architecture and the targeted operational context. Our structured framework functions as a reference to assist developers in selecting the most applicable metrics for their specific needs while establishing a standardized baseline for cross-model benchmarking.
The task of motion forecasting typically assumes ideal perception inputs, meaning that the ground-truth historical trajectories of all participants are provided alongside complete environmental map data. In real-world deployment, however, autonomous vehicle perception pipelines are subject to sensor noise, which manifests as false negatives, false positives, fragmented agent tracks, or identifier switches. To account for this, we perform a robustness evaluation that simulates typical perception system degradation.
We conduct an ablation study using the PGP [11] architecture, simulating object detector recall rates of 80%, 90%, and 95%—with the latter representing a realistic performance level under optimal operational conditions. This sensitivity analysis is executed independently for dynamic participant detection and static lane detection.
Individual traffic agents or lane fragments are filtered out using a Bernoulli distribution with omission probabilities of 20%, 10%, and 5%, respectively. Table 2 presents the resulting performance impacts for both lane boundaries and dynamic actors using minADEk, miss_ratek—which serve as the primary benchmarking criteria for the nuScenes leaderboard—and Behavioural Cloning (BC).
Table 2. Robustness analysis of PGP in NuScenes dataset. K = 10 for all experiments.
Object | Experiment | BC | Miss rate10 | Miss rate5 | minADE10 | minADE5 |
Baseline | 1.91 | 0.34 | 0.52 | 0.97 | 1.30 | |
Recall 100%, K = 10 |
|
|
|
|
| |
Lanes | Recall 95% | 2.51 | 0.38 | 0.55 | 1.01 | 1.36 |
Recall 90% | 3.0 | 0.40 | 0.57 | 1.04 | 1.41 | |
Recall 80% | 4.01 | 0.43 | 0.60 | 1.12 | 1.54 | |
Dynamic agents | Recall 95% | 1.93 | 0.34 | 0.52 | 0.97 | 1.30 |
Recall 90% | 1.93 | 0.35 | 0.53 | 0.97 | 1.31 | |
Recall 80% | 1.94 | 0.34 | 0.53 | 0.97 | 1.32 | |
Recall 50% temporal | 1.96 | 0.36 | 0.54 | 0.98 | 1.34 | |
No detected agents | 2.07 | 0.39 | 0.58 | 1.01 | 1.42 |
Note: Values in bold represent the best performance results within the comparative analysis.
Our analysis indicated that the PGP architecture demonstrates substantial resilience to detection failures concerning dynamic agents. Conversely, introducing noise into the perception of lane boundaries leads to a severe degradation in performance, particularly within the BC metric, owing to the critical reliance of this metric on lane geometry. This outcome stems from the model's heavy exploitation of lane information as a robust inductive bias, which implicitly encapsulates both the direction of traffic flow and permissible trajectories for each vehicle.
We conducted a second experiment to examine the consequences of failing to detect certain frames of agents interacting with the focal agent. These findings are presented in the second-to-last row. An interaction is defined here as a scenario where an agent's trajectory intersects a 20 m radius around the target vehicle. Each frame is assigned a 50% probability of detection. Under these conditions, the results do not indicate a significant decline in tracking performance.
Lastly, we executed a final experiment simulating a total failure in detecting any dynamic agents. The resulting data is displayed in the final row. On the basis of these outcomes, it is evident that the model is heavily dependent on both lane topological data and the historical trajectory of the focal agent itself.
To verify whether these observations generalize to alternative environments and architectures, we replicated the identical experimental setup using the DenseTNT model on the Argoverse dataset with K = 12.
Table 3 outlines the results of this robustness evaluation for DenseTNT. Mirroring the trends observed in the prior scenario, a failure to accurately perceive lanes inflicts a more severe penalty on accuracy than a failure to perceive dynamic agents. Once again, masking all surrounding agents reduces overall performance, yet the model maintains an acceptable level of operation. Interestingly, lane perception noise diminishes prediction diversity, whereas the masking of dynamic agents appears to enhance diversity—as indicated in the second-to-last row of Table 3. This behavior occurs because a reduction in perceived lanes narrows down the number of plausible paths. Conversely, omitting specific agents can cause the autonomous vehicle to target occupied areas, thereby increasing the diversity of the generated predictions at the expense of elevating collision risks. Admissibility drops when lanes are masked for identical reasons, while, as anticipated, the omission of environmental agents leaves this metric unaffected.
Table 3. Robustness analysis of DenseTNT in Argoverse dataset. K = 12 for all experiments.
Object | Experiment | DAC | RF | AvgFDE | Miss rate | minFDE | minADE |
Baseline | 0.971 | 5.053 | 5.447 | 0.043 | 1.078 | 0.763 | |
Recall 100%, K = 12 |
|
|
|
|
| ||
Lanes | Recall 95% | 0.971 | 4.954 | 5.499 | 0.049 | 1.110 | 0.777 |
Recall 90% | 0.971 | 4.849 | 5.577 | 0.059 | 1.151 | 0.799 | |
Recall 80% | 0.969 | 4.546 | 5.823 | 0.084 | 1.281 | 0.858 | |
Recall 70% | 0.967 | 4.156 | 6.144 | 0.120 | 1.478 | 0.948 | |
Dynamic agents | Recall 95% | 0.971 | 5.049 | 5.459 | 0.043 | 1.081 | 0.763 |
Recall 90% | 0.971 | 5.066 | 5.482 | 0.044 | 1.082 | 0.764 | |
Recall 80% | 0.971 | 5.099 | 5.522 | 0.044 | 1.083 | 0.765 | |
Recall 70% | 0.971 | 5.106 | 5.571 | 0.045 | 1.091 | 0.768 | |
Recall 50% temporal | 0.971 | 5.359 | 5.933 | 0.046 | 1.107 | 0.773 | |
No detected agents | 0.971 | 5.311 | 6.113 | 0.057 | 1.151 | 0.803 |
Note: Values in bold represent the best performance results within the comparative analysis.
The phenomena observed in this study can be attributed to multiple factors. First, the historical state of the focal agent—specifically its position, velocity, and acceleration—already provides a highly informative basis for inferring subsequent vehicle motion. Second, a vast majority of scenarios lack critical interactions that would fundamentally alter the future path of the focal agent. Although nuScenes ranks among the most challenging trajectory forecasting datasets and incorporates several highly interactive scenarios, the representation remains insufficient. This highlights a primary limitation in contemporary motion prediction benchmarks. In high-stakes safety scenarios, other road users ought to play a decisive role; however, this dynamic is poorly captured by current benchmarks, which fail to adequately cover diverse edge cases. Because these rare events are easily overlooked, they are frequently underrepresented in training datasets. While human drivers are naturally adept at handling extreme edge cases, autonomous systems struggle to do so, necessitating a careful and structured approach. Another insight derived from this analysis is the critical value of dynamic object detection. Object detectors are traditionally trained on isolated images, which can be suboptimal. Humans naturally interpret scene dynamics; if objects move relative to a static background, we recognize them with relative ease despite darkness, rainfall, or occlusions. A dynamic object detection system would prevent intermittent tracking losses across individual frames, thereby preventing downstream error propagation through the planning pipeline.
Discerning the underlying intentions of surrounding road participants is highly critical for mid- to long-term forecasting and decision-making processes. To navigate dynamically evolving traffic environments successfully, a multi-modal intention prediction component is indispensable for adapting to diverse scenarios. Intention prediction diverges from standard motion or trajectory forecasting in that it maps to discrete, high-level behaviors that are semantically distinct from one another, which can be interpreted as the discrete modes of the future trajectory distribution. A large number of trajectory prediction models lack inherent multi-modality and are prone to mode collapse. We aim to resolve output ambiguity by decoupling these modes into explicit, high-level behavioral intentions. Furthermore, this paradigm can enhance the interpretability of the overarching system, as it aligns more closely with human cognitive processes during driving.
Another prospective benefit of intention forecasting is its reduced sensitivity to the immediate actions of the autonomous vehicle compared to detailed trajectory tracking, where an agent's precise future path directly depends on the autonomous vehicle's actions during close interactions. This characteristic implies that intention prediction tasks hold greater viability for open-loop implementation.
The majority of literature in motion forecasting concentrates primarily on path regression, with only limited research addressing intention prediction [44, 45], which typically frames the task as a classification problem. Nevertheless, these existing techniques depend on predefined trajectories established via hand-crafted rules, failing to capture a holistic representation of the future distribution. These strategies lack standardized validation frameworks, making them suboptimal and causing them to lag behind state-of-the-art regression and generative frameworks. In this section, we investigate an alternative formulation for intention prediction using a straightforward, post-hoc method that can be superimposed onto various state-of-the-art multi-modal motion forecasting systems.
We extend the DenseTNT model [10] to execute intention prediction. We noted that the set of K candidate target goals generated for the focal agent are not fundamentally distinct. Frequently, they lie immediately adjacent to one another or exhibit severe spatial overlap. This phenomenon is highly likely caused by underlying uncertainty in the longitudinal motion profile. It would be considerably more practical and intuitive if each of the K endpoints represented a distinct behavioral choice, thereby separating longitudinal velocity uncertainty from strategic intent. Another limitation identified in this model is that the forecasted endpoints frequently violate admissibility constraints or traffic regulations, terminating off-road or within oncoming traffic lanes. It would likewise be advantageous to assign a probability metric to each mode to streamline downstream decision-making components.
A simple strategy to mitigate this involves clustering the varied outputs of DenseTNT into semantic intentions. As an initial step, we configured DenseTNT to generate 12 goals rather than its default 6—optimizing for the miss rate metric instead of FDE, as we reasoned these modifications would yield superior coverage of the output distribution. This adjustment successfully demonstrated increased diversity and a lower incidence of failure modes.
The model generates a collection of goals G ={g1; …; gN}, where each individual goal gn ∈ ℝ2 represents a coordinate in the bird's-eye-view plane. To encapsulate distinct behavioral intentions, we cluster these goals to form a set of clusters C = {c1; …; cK}. Each individual cluster ck is comprised of three distinct parameters, 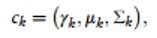 (1) where γk ∈ [0, 1], subject to ∑k γk = 1, denotes the probability of a specific goal falling within cluster k. The parameter k. μk ∈ ℝ2 signifies the mean spatial position of the cluster, while Σk ∈ ℝ2×2 represents the cluster's covariance matrix. It is worth noting that we anticipate the covariance to be elevated along the linear path of the lane—reflecting the velocity differentials between agents—and minimal orthogonal to the lane axis. We introduce a direct and intuitive strategy to resolve C.
Clustering constitutes an NP-hard optimization challenge, and widely adopted formulations like K-means clustering or expectation-maximization impose heavy computational burdens while occasionally converging toward degenerate solutions. Within our specific application context, however, a reliable partitioning of the bird's-eye-view plane is already accessible via the high-definition map's lane segments. Consequently, we propose generating clusters anchored directly on these lane segments. The heuristic procedure utilized to derive the clusters is outlined below. For each forecasted goal gn:
1) Identify all lane segments Ln = {l1, …, lM} that intersect within a radius r = 20m of the agent utilizing Manhattan distance. The bounding boxes for localized point clouds (lane centerline coordinates) are precomputed within the map architecture. If no matching lanes are retrieved, the search radius r is doubled.
2) Gauge the confidence score \delta of each lane segment according to its proximity to the nearest waypoint, pnm. Only lanes whose closest waypoint falls within a designated threshold radius t of 2.5 m are retained.
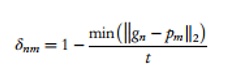 (2)
3) Determine the angular deviation between the agent's orientation for mode n and the vector direction of the lane, anm. Discard any lane segments whose directional alignment deviates from the agent's heading by more than 45°. This filtering step guarantees that we cluster exclusively those goals that conform to the current traffic flow direction.
Formally, let αnk represent the probability that a given goal gn is associated with cluster ck. We deliberately employ a soft assignment model. This architecture permits a single goal to map onto multiple clusters simultaneously, which represents a logical approach under conditions of high spatial uncertainty. Utilizing the retrieved lane segments Ln for each individual goal gn, we derive the assignment probability αnk as follows:
1) If two distinct lanes within Ln do not converge, or if neither serves as the immediate successor of the other, they are assigned to separate clusters.
2) The assignment probability αnk, denoting the membership of lane lm within cluster ck, is derived as a function of the distance to the nearest waypoint pnm and the angular alignment anm.
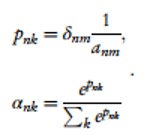 (3)
This heuristic framework is computationally streamlined and ensures that divergent operational intentions—such as maintaining lane centering versus initiating a lane change—are mapped to distinct clusters. This sequence is executed iteratively for each goal gn, consolidating the lane segments that correspond to identical clusters.
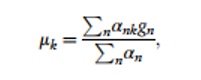 (4)
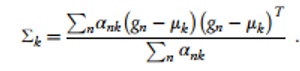 (5)
Following this, we evaluate the system parameters. To establish the discrete cluster probability γk, we leverage the localized intensity heatmap generated by DenseTNT. Extracting the confidence score of goal gn, designated as sn:
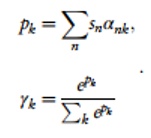 (6)
For the analysis, cluster visualization is conducted by adopting a hard clustering strategy, wherein every target destination is allocated to its most dominant cluster.
As illustrated in Figure 2, various driving conditions are examined. The autonomous vehicle (AV) is highlighted in red, whereas the primary agent, whose future path is being estimated, is depicted in green. Additional traffic participants are indicated by blue dots. The actual ground-truth path is traced in green.
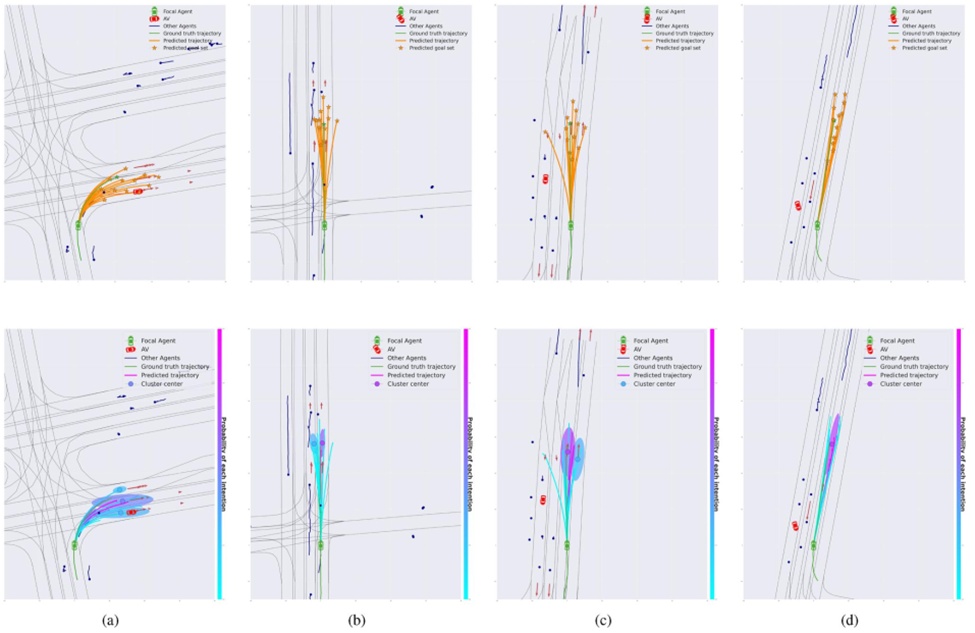
Figure 2. Qualitative evaluation: DenseTNT-Intent (lower row) groups the raw outputs generated by DenseTNT (upper row) into macro-level behavioral intentions. A specific probability is assigned to each distinct cluster according to the vertical color scale on the right. The centered circles indicate the mean position of each cluster. Translucent boundary contours map the spatial uncertainty within the velocity profiles. Unrealistic destinations that exit the drivable roadway or head into oncoming traffic streams are filtered out.
In the upper row, the raw trajectories computed by the baseline DenseTNT framework are rendered in orange, with the final projected endpoints marked by orange stars. Directed arrows depict the legal heading of each traffic lane.
The corresponding grouped results are displayed in the lower row. Estimated probabilities for each generated path map directly to the color scale shown on the right. The centers of these intentional clusters, which share the same color-coded probability mapping, are designated by colored circles. The structural uncertainty inherent to each behavior profile is captured by a shaded confidence ellipse derived from its covariance. As anticipated, the calculated covariance stretches further along the primary axis of the lane and contracts along the lateral axis, reflecting a more pronounced uncertainty regarding speed. To accommodate instances where a cluster captures only an isolated destination point, a predetermined default covariance is applied using structural a priori knowledge, specifically set to 2 m longitudinally along the lane and 0.05 m transversely across it (exemplified by the leftmost lane cluster in Figure 2).
In the first scenario (column one), three separate intentions are identified—one for each available lane—with the center lane registering the highest likelihood. In the second scenario, the framework predicts two distinct behavioral intentions: car-following and lane-changing behavior. Any predicted endpoint that exits the boundaries of the road surface is systematically omitted from the grouping process. The third scenario highlights how this framework filters out anomalous destinations that breach driving regulations, such as paths leading into opposing traffic lanes. In the final scenario, the baseline model predictions are distributed along both outer boundaries of a single lane; here, the method consolidates them into a single, unified intention.
It is worth noting that this technique differs fundamentally from standard heatmap models, which output a dense grid of localized cell probabilities across the spatial environment for a specific timestamp. Although heatmaps capture the spatial distribution of potential trajectories well, they fail to explicitly isolate the underlying high-level macro-intentions of the tracked agent. This represents a core constraint when applications demand the separation of distinct behavioral modes to accurately forecast an agent's definitive objective or target endpoint. Conversely, the proposed clustering technique successfully extracts the most probable high-level maneuvers of the agent, yielding an output that is both more interpretable and directly actionable for downstream systems.
This approach does more than simply resolve ambiguities in multi-modal trajectory outputs by highlighting the discrete intentions predicted by the network; it simultaneously enhances the regulatory compliance of the final output paths. The grouping mechanism filters out non-plausible destination points that violate standard traffic laws, such as off-road trajectories or paths driving against oncoming traffic.
To validate this claim empirically, we evaluate metrics for Drivable Area Compliance (DAC) and Off-Traffic Direction (OTD) across both the baseline DenseTNT model and our modified framework, designated as DenseTNT-Intent.
We compute two metrics of diversity: p-RF and variance of the final heading for the different output modes, for the whole output—12 modes—and the 3 most probable outputs. We propose to modify RF and compute instead the ratio of the probabilistic versions of avgFDE and minFDE, p-RF. p-avgFDE is computed following the same heuristic as p-minFDE. For each sample with K trajectories:
 (7)
Ultimately, probabilistic accuracy metrics are introduced to contrast the performance of both networks. All evaluated metrics must be assessed concurrently to establish a comprehensive, holistic understanding of performance. These findings are detailed in Table 4.
Table 4. Quantitative results for DenseTNT (12 modes) and DenseTNT-intent in terms of diversity, admissibility, and accuracy. Improvements are indicated by arrows. The first two rows show results for the whole validation set. The third and fourth row consider top 3 predictions. The last two rows describe the results for the subset of scenes with more than one plausible mode.
Evaluation method | Model | Admissibility |
| Diversity |
| Accuracy |
|
| |
OTD (%) (↓) | DAC (↑) | p-RF (↑) | p-MR (↓) | p-avgFDE (↓) | p-minFDE (↓) | p-minADE (↓) | |||
Whole | DenseTNT | 6.99 | 0.97 | 0.096 | 2.65 | 0.79 | 8.03 | 3.03 | 2.71 |
k = 12 | DenseTNT-Intent | 0 | 0.99 | 0.034 | 1.45 | 0.60 | 4.45 | 3.07 | 1.67 |
Whole | DenseTNT | 6.98 | 0.021 | 0.020 | 1.43 | 0.73 | 4.67 | 3.25 | 2.25 |
k = 3 | DenseTNT-Intent | 0 | 0.036 | 0.037 | 1.45 | 0.60 | 4.45 | 3.09 | 1.67 |
Subset | DenseTNT | 7.08 | 0.98 | 0.020 | 1.44 | 0.73 | 4.93 | 3.39 | 2.32 |
k = 12 | DenseTNT-Intent | 0 | 0.98 | 0.058 | 1.66 | 0.68 | 5.43 | 3.28 | 1.89 |
Note: Values in bold represent the best performance results within the comparative analysis.
The baseline DenseTNT framework exhibits superior diversity metrics when evaluated across its full output spectrum of 12 distinct predictions. This outcome stems primarily from the fact that our clustering mechanism eliminates low-quality anomalous paths, naturally compressing the variance observed in the yaw angle. Following this same mechanical pattern, the avgFDE yields higher values for DenseTNT, whereas the minFDE shifts lower. Consequently, the standard RF ratio scales higher for DenseTNT.
However, the traditional RF metric quantifies raw diversity in isolation without factoring in the structural validity of the generated paths. Furthermore, 90.7% of the maneuvers executed by the target agents consist of simple straight-line driving. In the majority of these situations, the underlying uncertainty is localized entirely within the speed profiles rather than the macroscopic directional intent, resulting in the generation of only a single path cluster. Figure 2d illustrates a clear instance where spatial variance is significantly inflated within DenseTNT prior to the application of the clustering layer.
We choose to test this hypothesis under two alternative testing configurations. First, we restrict the evaluation to isolate only the three highest-probability paths (k = 3). Under these constraints, the clustered framework demonstrates superior diversity across both yaw variance and the p-RF metric. Second, we isolate a specific subset of the validation corpus containing only driving scenarios where the real-world trajectory distribution exhibits more than one plausible behavioral option. As anticipated, this complex subset yields the most favorable diversity performance for our method. For the subsequent analysis of accuracy and admissibility, we focus on the complete dataset configured with K = 12, given that no substantial shifts are observed across the remaining dimensions.
The established admissibility benchmarks demonstrate that grouping output trajectories into macro-level behaviors yields highly compliant path predictions. This is evidenced by a complete absence of clusters heading into opposing lanes of traffic and a 2 percentage point (2pp) improvement in the DAC metric. Our analysis shows that nearly 7% of the unclustered baseline predictions project paths that travel in reverse against the legal direction of traffic.
To ensure a balanced appraisal, we also investigate the direct consequences of clustering on spatial accuracy metrics. When evaluating the probabilistic variants of distance-based benchmarks, DenseTNT-Intent exhibits superior performance across p-minADE, p-avgFDE, and p-MR. This advantage arises because it generates fewer total behavioral modes while concentrating higher probability density onto the true ground-truth intent. However, because the raw DenseTNT model outputs a larger volume of individual trajectories with wider structural variance across its speed profiles, it maintains a higher statistical likelihood of placing an individual path closer to the ground-truth line before clustering occurs, which results in a lower p-minFDE score for the baseline DenseTNT model.
These compiled findings indicate that DenseTNT-Intent produces predictions that conform more closely to environmental and contextual constraints. It delivers these results as clear behavioral intentions that successfully encompass the modes of the output distribution while upgrading the structural quality of the trajectory outputs. This refined output format can be leveraged to reinforce the operational safety and reliability of autonomous driving frameworks by enabling more informed tactical decision-making and highly precise forecasting of surrounding agent behaviors.
This section evaluates the core premise that the way multi-modal trajectory options are visually communicated directly influences how easily human operators can understand the underlying system. To test our null hypothesis, we designed an empirical study evaluating how various trajectory visualization formats—specifically manipulating probability markers, mode density, and temporal look-ahead windows—affect the perceived clarity of the system, and how these factors subsequently shape operational transparency and user confidence.
A sample of 39 technical professionals was assembled to complete a twenty-minute, within-subjects questionnaire. Women comprised twenty-three percent of the cohort, a demographic distribution that mirrors current baseline participation rates across engineering and computing disciplines. This instrument gauged technical comprehension by presenting participants with diverse visual depictions of the data stream generated by automated trajectory forecasting architectures.
The investigation was structured into two primary components. The graphical representations used in the first phase were constructed from PGP network outputs evaluated on the nuScenes Trajectory Prediction benchmark. The second phase leveraged raw predictions generated by the DenseTNT architecture using the Argoverse Motion Forecasting framework. Selecting these two widely utilized datasets allowed us to maximize the diversity of the study, as both represent leading benchmarks in contemporary multi-modal research. This dual-source approach also introduces structural variation regarding how behavioral options are calculated, given that DenseTNT relies on anchor-free target destination proposals while PGP operates via lane-graph topological sampling.
Every experimental condition within the study was analyzed using three distinct response formats: an A/B forced-choice comparison, a five-point Likert agreement scale to capture subjective impressions, and a final qualitative open-ended text field where respondents could detail their reasoning. This qualitative component provides essential context by capturing the user's specific feedback in their own words. For an in-depth review of the instrument design, please see the supplementary materials. The systemic design of the survey and its operational variables are outlined below:
Section 1. PGP visualisations in nuScenes dataset.
o (a) Introduction and baseline visualisation with no predictions.
o (b) Case 1. Single mode versus multi-mode.
o (c) Case 2. Number of modes: 10 modes versus 3 modes.
o (d) Case 3. Prediction time horizon: 6 versus 2s.
o (e) Case 4. Importance of cameras view as an additional visualisation.
Section 2. DenseTNT and DenseTNT-intent visualisations in the Argoverse dataset.
(a) Introduction and baseline visualisation with no predictions.
(b) Case 5. Single mode versus multi-mode.
(c) Case 6. Trajectory prediction versus intention prediction.
These experimental conditions were explicitly curated around the behavioral variables investigated in this research, alongside specific visualization parameters that currently lack standardization across public benchmarks.
Descriptive and inferential data trends are aggregated in Table 5. Responses from the 5-point Likert items were evaluated as interval data, allowing for traditional reporting of means, variances, and modes. Aggregating ordinal Likert responses into continuous mean metrics is mathematically justified here under the Central Limit Theorem. We utilized Welch's t-test to cross-examine our hypotheses and verify whether the mean differences between distributions across the test cases achieved statistical significance. The resulting test statistics, exact p-values, and degrees of freedom are fully detailed in Table 5. The corresponding proportional distributions for the A/B selections are visualized in Figure 3. The following subsections unpack our specific empirical insights for each testing condition.
Table 5. Evaluation of survey results: Descriptive and inferential statistics for each of the cases under study. k is the number of modes, being n > 1 the multi-modal scenario. We provide mean, variance, and mode as descriptive statistics. For inferential statistics, test statistic, p value and degrees of freedom (dg) based on Welch's test are shown. nS refers to nuScenes, AV refers to the Argoverse dataset.
Comparison | Statistic | Condition 1 | Condition 2 |
k = 1 vs. k > 1 (nS) | Mean | 3.410 | 4.179 |
Variance | 0.879 | 0.458 | |
Mode | 3 | 4 | |
t-Statistic | −4.139 | — | |
p-value | 9 × 10⁻⁵ | — | |
Degrees of Freedom (df) | 69 | — | |
k = 3 vs. k = 10 | Mean | 3.821 | 3.641 |
Variance | 0.835 | 1.025 | |
Mode | 4 | 4 | |
t-Statistic | 0.822 | — | |
p-value | 0.41 | — | |
Degrees of Freedom (df) | 75 | — | |
6 s vs. 2 s | Mean | 4.333 | 2.872 |
Variance | 0.3333 | 0.6932 | |
Mode | 4 | 3 | |
t-Statistic | 9.007 | — | |
p-value | 10⁻¹⁰ | — | |
Degrees of Freedom (df) | 67 | — | |
k = 1 vs. k > 1 (AV) | Mean | 3.282 | 3.589 |
Variance | 0.997 | 1.143 | |
Mode | 3 | 4 | |
t-Statistic | −1.313 | — | |
p-value | 0.193 | — | |
Degrees of Freedom (df) | 75 | — | |
Trajectories vs. Intentions | Mean | 3.205 | 4.102 |
Variance | 0.693 | 0.568 | |
Mode | 3 | 4 | |
t-Statistic | −4.989 | — | |
p-value | 1.9 × 10⁻⁶ | — | |
Degrees of Freedom (df) | 75 | — |
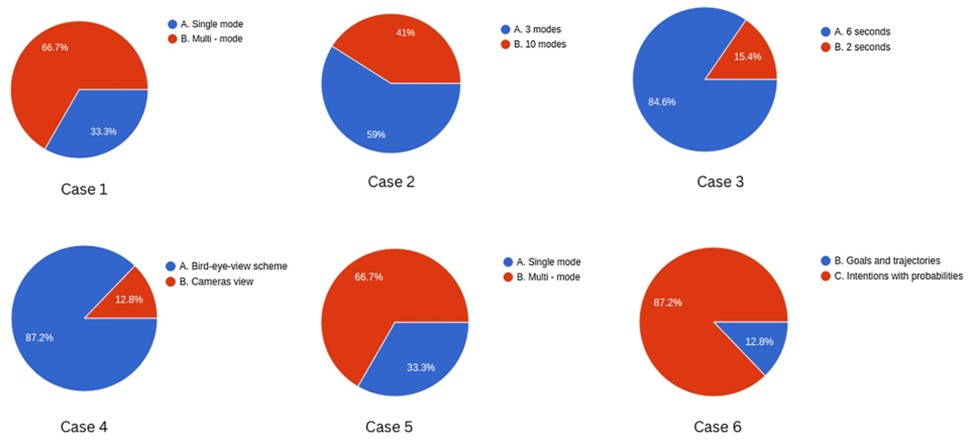
Figure 3. A/B questions pie charts.
1) Single mode versus multi-mode predictions. This initial setup leveraged PGP outputs on the nuScenes corpus to evaluate whether displaying multiple potential future paths yields better system interpretability than reducing the output to a single deterministic path. Only 20% of the sample favored the single-path representation for understanding the system's intent. Interestingly, these specific respondents noted that while multi-path displays increased visual clutter and cognitive load, they simultaneously made the underlying tracking technology feel more dependable.
Statistically, the multi-mode visualization generated a substantial 0.8-point advantage on the interpretability scale compared to the single-mode baseline, achieving a p-value of 9 \cdot 10^{-5}. This clear divergence strongly reinforces our assertion that capturing path multiplicity enhances output interpretability.
2) Three modes versus ten modes. This scenario investigated where the ideal threshold of path multiplicity lies for human operators attempting to interpret vehicle choices. A minority of 41% selected the complex 10-mode display over the streamlined 3-mode alternative. The dominant narrative among the qualitative feedback suggested that tracking 10 distinct trajectories simultaneously is highly taxing for human cognition, yet it gives the impression of a more robust, comprehensive backend algorithm, which builds trust. However, when comparing the two conditions via subjective 5-point Likert ratings, the mean scores across both distributions revealed no statistically meaningful variance.
3) Prediction time horizon: 6s versus 2s. Here, we scrutinized how expanding the temporal projection window impacts an observer's grasp of the vehicle's intentions. A definitive 84.6% majority preferred the extended 6-second look-ahead over the restricted 2-second window. The prevailing consensus was that the 6s projection delivers the broader contextual narrative required to accurately read a unfolding traffic scenario.
Analysis of the Likert ratings revealed a highly significant 1.5-point gap between the distribution means, carrying a p-value of 10^{-10}. This result matches our working hypothesis that extended forecast horizons drastically improve both the interpretability of automated driving behavior and overall user trust.
4) Cameras view as additional visualisation. This test condition assessed how integrating auxiliary perspective data—specifically via six perimeter cameras mounted on the host vehicle—affects a user's situational awareness. Seventy percent of the cohort reported that this multi-perspective layout directly aided their comprehension of the driving scene, while 87.2% stated it specifically clarified the immediate maneuvers and predicted paths of the target vehicle.
5) Single mode versus multi-mode predictions with DenseTNT on the Argoverse dataset. To evaluate whether the specific dataset layout or the underlying network architecture alters user perception, we replicated the first experiment using the DenseTNT model on Argoverse data. This trial yielded a distinct shift in user sentiment: 33.3% of the participants chose the single-path option for clarity. The most profound divergence, however, appeared in the Likert scales, where the mean scores for both conditions converged almost perfectly, stripping away any statistical significance between the groups. This deviation is heavily linked to the default formatting of the baseline DenseTNT model, which outputs 12 unweighted, unranked trajectories. Users reported that this raw, unprobabilistic delivery makes the output highly difficult to decode. This finding strongly validates our argument for applying a downstream clustering layer to translate raw paths into clear, probability-weighted intentions—the exact focus of our final test case.
6) Trajectory prediction versus intention prediction. Here, we validated the primary framework introduced. We argued that framing predictions as core intentions rather than raw coordinate paths enhances interpretability by decluttering the output space and mimicking human driving logic. This was confirmed by 87.2% of respondents, who found that grouping trajectories into distinct, probability-mapped behavioral options made it significantly easier to interpret the focal agent's future movements.
The qualitative feedback heavily emphasized that identifying a macro-level maneuver is far more practical than analyzing a collection of pinpoint coordinate points, as it directly mirrors human spatial reasoning. Other participants noted it accelerates real-time interpretation, preserves critical scene data, and strips away the visual noise of overlapping lines. Furthermore, users emphasized that preserving variance metrics within these predictions is essential for allowing downstream planning algorithms to execute safe, probabilistic calculations. Conversely, a small minority of 5 participants felt this abstracted grouping method was more confusing than looking at raw lines.
Inferential testing of the Likert data revealed a statistically sound 0.9-point shift between the mean scores of the two groups, yielding a definitive p-value of 3 \cdot 10^{-6}. This empirical result firmly confirms our hypothesis that restructuring trajectory data into intentional clusters significantly improves human understanding of predictive automated systems.
Several limitations inherent to this research must be acknowledged. First, data collected via Likert scales can be affected by response distortions, specifically central tendency bias (the tendency of participants to evade extreme options) and acquiescence bias (the predisposition to agree with survey prompts).
Second, the forced-choice nature of the A/B questions did not permit respondents to select a neutral stance if they had no preference. To mitigate this, however, participants could clarify their positions through the Likert scale items and the open-ended fields tied to each specific scenario. This contextual factor was deliberately accounted for during data analysis.
Lastly, certain participants noted ambiguity regarding the intent behind specific items, pointing out that their selections were heavily contingent upon the exact task at hand. For instance, a software developer might prioritize detailed information over a streamlined interface, even if it results in a more intricate visual display. Responses were also influenced by external variables such as traffic conditions, vehicle velocity, and road complexity; these factors dictate that the ideal prediction horizon or number of distinct modes will vary from one situation to the next.
Notwithstanding these constraints, several meaningful insights can be extracted from the collected data.
To begin with, the results substantiate our hypothesis that multi-modality serves a dual purpose: it supports superior decision-making and safer route planning, and it simultaneously clarifies the inner workings of prediction systems when accompanied by effective visualization techniques. A key corollary to this is that the structural layout of the visualization is paramount; the varying probabilities linked to each discrete trajectory must be communicated transparently.
Furthermore, extending the temporal reach of prediction horizons fosters a more comprehensive understanding of the broader traffic environment, thereby enhancing the interpretability of the architecture as a whole.
Finally, the empirical survey data strongly reinforces the necessity of intention prediction. Utilizing clustered outputs allows the system to organize predictions into high-level behaviors, yielding a representation that closely mirrors human cognitive processing.
This research advances the development of dependable motion prediction architectures by systematically addressing output evaluation, robustness, and interpretability.
The primary contributions and insights of this study are structured below:
Evaluation Methodologies: We exposed major discrepancies and shortcomings in contemporary evaluation strategies, particularly regarding the omission of diversity metrics and compliance with environmental constraints. By pinpointing these vulnerabilities in multi-modal motion prediction assessment, we introduce a more holistic and integrated evaluation framework.
Robustness Analysis: Our vulnerability testing demonstrated that errors in capturing road topology degrade system performance much more severely than errors in tracking surrounding agents. This vulnerability stems from the powerful inductive biases that lane structures impose on the model. This finding underscores the urgent demand for richer datasets featuring intricate agent interactions and diverse edge-case scenarios.
Intent Integration: We generated DenseTNT-intent outputs mapped to high-level behavioral intentions. These outputs proved to be simultaneously diverse, rule-compliant, and precise, thereby elevating the overall fidelity of the generated trajectories.
Interpretability Assessment: The empirical findings indicate that transitioning to this novel representation significantly clarifies the model's output predictions. The data confirms our baseline hypothesis that multi-modal outputs offer superior interpretability compared to single-mode alternatives. Finally, long-term trajectory projections consistently provide operators with a clearer grasp of the anticipated traffic environment.
The frameworks and findings established here offer a foundational blueprint for engineering reliable motion prediction pipelines in autonomous driving systems. By critically examining existing metrics, mapping their structural flaws, and introducing a multi-dimensional evaluation paradigm, this study establishes a rigorous baseline for subsequent academic inquiry. Moreover, the design of a specialized methodology for evaluating spatio-temporal resilience—coupled with the implementation of an intentional prediction layer—presents creative remedies for the core bottlenecks of multi-modal tracking. Ultimately, evaluating interpretability through user assessments of distinct visual presentation formats yields actionable design principles for building transparent autonomous systems. Taken together, these milestones represent a distinct evolutionary step toward deploying dependable artificial intelligence for secure and optimized autonomous vehicle operation.
This work was supported by HUMAINT project at the Algorithmic Transparency Unit at the Directorate-General Joint Research Centre (JRC) of the European Commission, and in part by the Spanish Ministry of Science and Innovation under Grant PID2020-114924RB-I00, and by the Community Region of Madrid under Grant S2018/EMT-4362 SEGVAUTO 4.0-CM. In addition, part of this work has been carried out during the Eye for AI Program thanks to the support of Zenseact and AI Sweden.
None
None
None
Open Access The author(s) retain copyright. This article is licensed under the Creative Commons Attribution-NonCommercial-ShareAlike 4.0 International License. It may be shared and adapted for non-commercial purposes with appropriate attribution, an indication of changes, and distribution of adaptations under the same license. Third-party material may be subject to separate terms identified in its credit line. View the license at https://creativecommons.org/licenses/by-nc-sa/4.0/.
 Transparent Intelligence Publishing