The accurate determination of genotype and the clinical outlook for individuals with glioma present notable challenges, frequently relying on subjective evaluations and minimal scientific backing. This investigation intends to establish a dependable, noninvasive, preoperative learning framework based on a multi-modal MRI transformer to forecast IDH genotyping alongside glioma outcomes. This multi-institutional investigation gathered 563 individuals with glioma to construct an interpretable categorization model that leverages diverse preoperative imaging tracks, such as T1-weighted, T2-weighted, fluid-attenuated inversion recovery, contrast-enhanced T1-weighted, and diffusion-weighted imaging. The system utilizes a multi-task learning architecture designed to isolate and merge radiomic, deep learning, and clinical variables for IDH genotyping and glioma prognosis. Furthermore, a multi-modal transformer technique is incorporated to evaluate anatomical and functional MRI scans, thereby boosting the capabilities of the model. Empirical outcomes demonstrate that the framework achieves exceptional capability, outperforming prior investigations and alternative state-of-the-art approaches. The model attains an AUC of 91.40% for the IDH genotyping objective and 93.37% for the glioma prognosis objective. Subgroup evaluations indicate that the system displays heightened sensitivity toward IDH-mutant instances and identifies low-risk cohorts with greater precision than medium- or high-risk cohorts. This investigation intends to achieve precise IDH genotyping and glioma prognosis through an efficient classification methodology, delivering helpful diagnostic perspectives for clinical workflows and accelerating therapeutic determinations.
Glioma, representing the most prevalent primary malignancy of the brain in adult populations, arises from the interplay between innate genetic vulnerabilities and environmental mutagens, which precipitates the neoplastic transformation of glial cells within the cerebrum and spinal cord [1]. Typically, gliomas are characterized by unfavorable clinical outcomes and inflict substantial debility [2]. Depending on the degree of malignancy, the World Health Organisation categorizes these tumors into low-grade gliomas (LGG) and high-grade gliomas (HGG), alongside distinct therapeutic interventions [3]. LGGs exhibit lower malignancy and less infiltrative behavior, demonstrating a median survival time (MST) of 8–10 years post-appropriate intervention. Conversely, HGGs display aggressive malignancy and extensive invasiveness, culminating in a curtailed MST. Gliomas hinder therapeutic success owing to secondary complications, such as elevated intracranial pressure, cerebral edema, and herniation syndromes, which drive elevated recurrence and fatality rates [4]. The marked clinical diversity of gliomas requires the concurrent investigation of LGG and HGG cohorts to pin down the vital parameters governing patient survival and longitudinal quality of life. Evaluating prognostic indicators across glioblastoma and LGG expressions can uncover the primary variables driving clinical results across different tumor grades, thereby informing clinical strategies to optimize therapeutic success.
Even though standardized multi-modal management for gliomas has found widespread clinical implementation, its therapeutic success differs substantially across distinct genetic expressions [5]. Isocitrate dehydrogenase (IDH) functions as a pivotal molecular biomarker for the genetic stratification of gliomas, profoundly affecting tailored therapeutic paths and clinical outlooks [6]. Individuals presenting with divergent glioma genotypes display prominent variances in survival durations [7]. While the histopathological evaluation of tumor tissue specimens continues to be the definitive benchmark for genotyping, acquiring these specimens via needle biopsy or operative resection is inherently invasive and susceptible to geographic sampling errors. Genetic stratification not only exerts a profound influence on the initiation and advancement of gliomas but also fundamentally dictates patient survival outcomes [7]. Consequently, there is an urgent imperative to engineer novel, noninvasive algorithmic techniques to reliably identify IDH mutations, thereby steering clinical management and appraising longevity expectations.
Magnetic resonance imaging (MRI) represents an established diagnostic modality in clinical medicine that yields exceptional soft-tissue differentiation, precisely illustrating the structural anatomy of human soft tissues [8]. It exhibits profound sensitivity regarding the location and spatial footprint of gliomas. MRI offers a noninvasive avenue to evaluate the IDH genetic profile, given that multiple imaging markers exhibit strong associations with specific IDH genotypes, thereby assisting in predicting glioma outcomes [9]. Powered by the progression of artificial intelligence (AI), an increasing array of computer-assisted analytical applications are being deployed to detect gliomas and alternative intracranial neoplasms [10]. Prior investigations have explored the evaluation of IDH genotyping and patient survival by exploiting radiomic signatures and deep learning algorithms [11, 12]. Radiomics entails a meticulous multi-tier workflow encompassing image acquisition, data standardization, tumor boundaries delineation, radiomic feature derivation, feature pruning, and predictive modeling [13]. The core advantage of deep learning relies on its end-to-end training capacity, which automatically uncovers hierarchical layers of data representations to fulfill a predictive objective, wherein the outputs of an antecedent layer serve as the feature inputs for the succeeding level [10].
Radiomic strategies and deep learning approaches each provide unique benefits for capturing image-based data. Nevertheless, current investigations commonly rely on a single methodology for predicting IDH genotypes and estimating glioma prognosis, which restricts the multi-layered and multi-perspective harvesting of imaging data and consequently bounds the predictive capacity of the model. This manuscript presents an AI framework that marries radiomic features, deep learning vectors, and clinical parameters. The synthesis of structural and functional MRI information is executed via a multi-modal transformer. The transformer, representing a premier innovation within computer vision, has demonstrated remarkable efficacy in the domain of medical imaging [14]. By leveraging attention architectures, the transformer independently isolates the most significant features, thereby boosting the predictive precision of IDH genotyping and survival estimations.
Different IDH genotypes present unique structural indicators on conventional MRI tracks. Specifically, IDH-mutant gliomas are characterized by distinct nonenhancing tumor borders and minor cystic components, whereas IDH-wildtype gliomas frequently involve the bilateral thalamus accompanied by central necrotic regions and ill-defined contrast enhancement boundaries [15]. These radiologic manifestations assist neuroradiologists in differentiating glioma categories during clinical practice. Even so, the precise differentiation of genetic profiles based purely on MRI manifestations remains difficult due to internal tumor heterogeneity. Furthermore, existing computerized tools commonly implement single-task designs, overlooking the intrinsic relationships connecting IDH genotypes and survival risks. Consequently, the concurrent training of IDH genotyping and mortality risk modeling within a unified deep learning architecture offers a compelling strategy for advancing sophisticated biomedical imaging.
In this investigation, we introduce an interpretable multi-task learning architecture designed to concurrently solve IDH genotyping and mortality risk appraisal utilizing multi-modal inputs. Structurally, radiomic characteristics, deep learning parameters (isolated from structural and functional MRI tracks via the multi-modal transformer), and clinical profiles are gathered and processed. Joint information and comprehensive patient profiles are consolidated through the fusion of these diverse data channels. These aggregated streams are subsequently channeled through a synthesis layer to yield objective-specific predictions.
Validation trials conducted on a multi-centre registry show that the formulated methodology yields encouraging diagnostic capabilities, outperforming multiple current state-of-the-art architectures for both IDH genotyping and glioma survival classification. The primary advancements are outlined as follows:
A multi-task algorithmic structure is engineered for concurrent IDH genotyping and glioma survival tracking utilizing multi-modal imaging assets, encompassing structural and functional MRI protocols. Radiomic, deep learning, and clinical metrics are comprehensively extracted and blended.
To improve the capture of distant spatial associations within imaging fields and isolate features across varied resolutions, we engineered a three-tiered structural hierarchy to produce multi-scale feature maps.
The implementation of a multi-modal transformer learning framework, which couples DFPatchEmbed and the ExTransformer for multi-sequence imaging evaluation, markedly enhances operational throughput and precision within IDH genotyping and glioma tracking workflows.
To source globally generalizable evidence, a series of multi-institutional imaging registries were leveraged in this investigation (Figure 1). Every individual diagnosed with glioma who was enrolled presented prior to any surgical intervention. The initial cohort, designated as Dataset1, represents an NIH/NCI-sanctioned retrospective analysis of the public The Cancer Imaging Archive (TCIA) glioma repositories, encompassing 444 individuals with HGG and 56 individuals with LGG [16-18]. Because all records archived within these NCI databases are stripped of identifying information, separate institutional IRB clearance was not required for this retrospective study. The secondary cohort, designated as Dataset2, gathers cases treated between the years 2012 and 2020 derived from the PACS platform of Henan Provincial People’s Hospital, enclosing 43 individuals with HGG and 20 individuals with LGG. All compiled cases adhere strictly to the tenets of the Declaration of Helsinki and received formal sanction from the Institutional Review Board of Henan Provincial People’s Hospital (clearance identifier: 2021148). Selection benchmarks: (1) Individuals who received zero surgical procedures, radiotherapeutic courses, systemic chemotherapies, or alternative therapeutic options prior to the index MRI scan. (2) Individuals who underwent surgical resections within a 1-week window post-MRI examination, with confirmed histopathological evidence of glioma via surgical pathology. (3) Individuals presenting with comprehensive surgical pathology files and complete clinical histories. Exclusion benchmarks: (1) Individuals presenting with a history of moderate traumatic brain injuries or cerebrovascular accidents. (2) Individuals exhibiting compromised image resolution or artifacts that impede reliable analysis. (3) Individuals lacking verified IDH mutation markers or definitive overall survival tracking records.
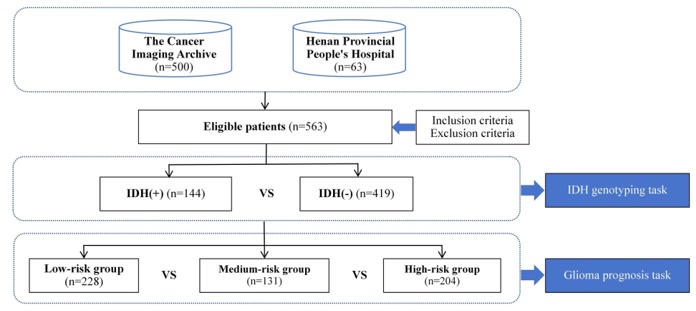
Figure 1. Flowchart of patient enrollment and study objectives.
The imaging repositories comprised T1-weighted (T1w) sequences, T2-weighted (T2w) sequences, fluid-attenuated inversion recovery (FLAIR) sequences, contrast-enhanced T1-weighted (CET1w) sequences, and diffusion-weighted imaging (DWI) profiles. All pre-operative imaging assessments were executed utilizing a 3.0 T imaging platform (Discovery 750, GE Healthcare, Waukesha, Wisconsin, USA) equipped with a dedicated 8-channel cranial array coil (Invivo, Gainesville, Florida, USA). These five separate imaging channels document distinct radiologic features of gliomas from multiple diagnostic perspectives. Every scan across both cohorts underwent manual spatial segmentation executed by one to four independent annotators using the itk-SNAP software package, adhering to a unified segmentation manual. The resulting structural contours were audited and validated by expert neuroradiologists.
The architecture of the engineered multi-task learning system is mapped out in Figure 2, which is broken down into five distinct operational phases: (a) Data acquisition, combining multi-sequence radiological scans with clinical registries; (b) Image preprocessing; (c) Radiomic signature extraction; (d) Multi-task algorithmic execution for concurrent IDH mutation prediction and survival forecasting, achieved by integrating radiomic, deep learning, and clinical variables; and (e) Generation of final IDH status and patient prognostic outputs.
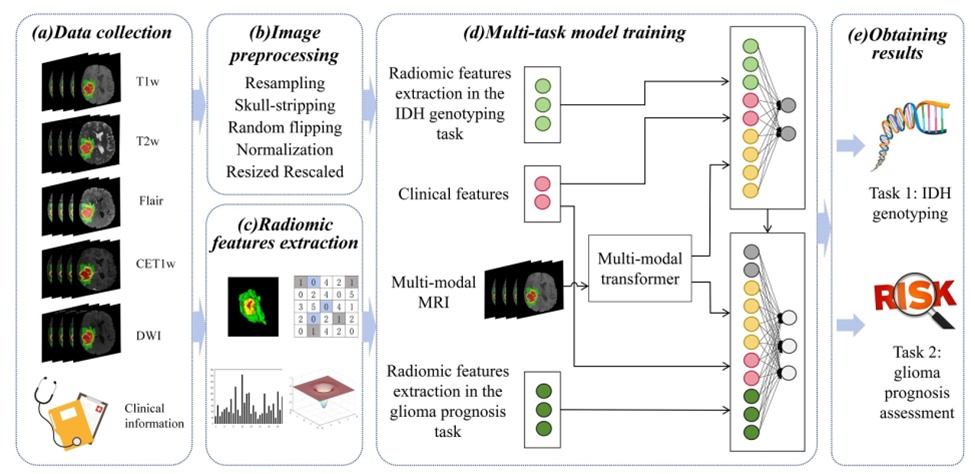
Figure 2. Overall research flowchart of IDH genotyping and glioma prognosis assessment. CET1w, contrast-enhanced T1-weighted imaging; DWI, diffusion-weighted imaging; FLAIR, fluid-attenuated inversion recovery imaging; T1w, T1-weighted imaging; T2w, T2-weighted imaging.
To initiate the workflow (Figure 2b), multi-modal MR records are standardized through volumetric spatial resampling to an isotropic resolution of 1\text{ mm}^3, followed by automated skull stripping and random mirror reflections across all three spatial axes. Subsequently, each distinct imaging sequence per patient undergoes individual Z-score normalization based on the mean and standard deviation calculated across the intracranial space. To eliminate extreme outliers, the volumes are clipped and reshaped to spatial dimensions of [128, 128, 112], with a final intensity rescale to the range [0, 1] to suppress inter-scan lighting and intensity variations.
By applying quantitative radiomic extraction routines, 1051 individual metrics encompassing statistical distributions, geometric shapes, and texture patterns are computed from the defined tumor volumes. To isolate highly reliable, distinct, and statistically independent variables, the entire feature space is initially uniformized via Z-score scaling. Significant features are then isolated using a Mann–Whitney U test, filtering for variables where p < 0.05 [19]. Following this initial screening, a Least Absolute Shrinkage and Selection Operator (LASSO) logistic regression model is executed to strip away multicollinearity and redundant data dimensions [20]. This dimensionality reduction pipeline serves to streamline data density, boost processing throughput, and refine the downstream model architecture. The final subset of robust features is subsequently channeled into the model for network training.
The underlying schematic of the multi-modal transformer framework is depicted in Figure 3a, which processes visual features derived across T1w, T2w, FLAIR, CET1w, and DWI sequences via attention-driven learning. To maximize the capturing of long-range spatial dependencies and preserve multi-scale resolution data, the transformer network leverages a three-tiered hierarchical configuration. This enables the parallel extraction of high-resolution, localized low-level details alongside rich semantic abstractions at deeper layers (Figure 3b). Within every hierarchical tier (Figure 3c), a combination of a diffused patch embedding layer (DFPatchEmbed) and an extended transformer encoder (ExTransformer) is implemented. The feature maps output by the convolution layers are processed by the DFPatchEmbed module, embedded with positional encodings, and then routed directly into the ExTransformer. Lastly, the feature tensors are reshaped to interface with the next sequential layer stack. Each intermediate convolution within these stacked blocks incorporates batch normalization and a Hardswish activation function. This multi-modal learning design utilizes a parallel multipath routing system to cleanly handle disparate MRI sequence characteristics. Relative to conventional convolutional neural networks, this architecture exhibits a superior capacity for contextualizing global relationships, which substantially improves spatial pattern recognition. Furthermore, the multi-modal transformer optimizes parameter density by sharing sub-block weights, which significantly increases network training velocity.
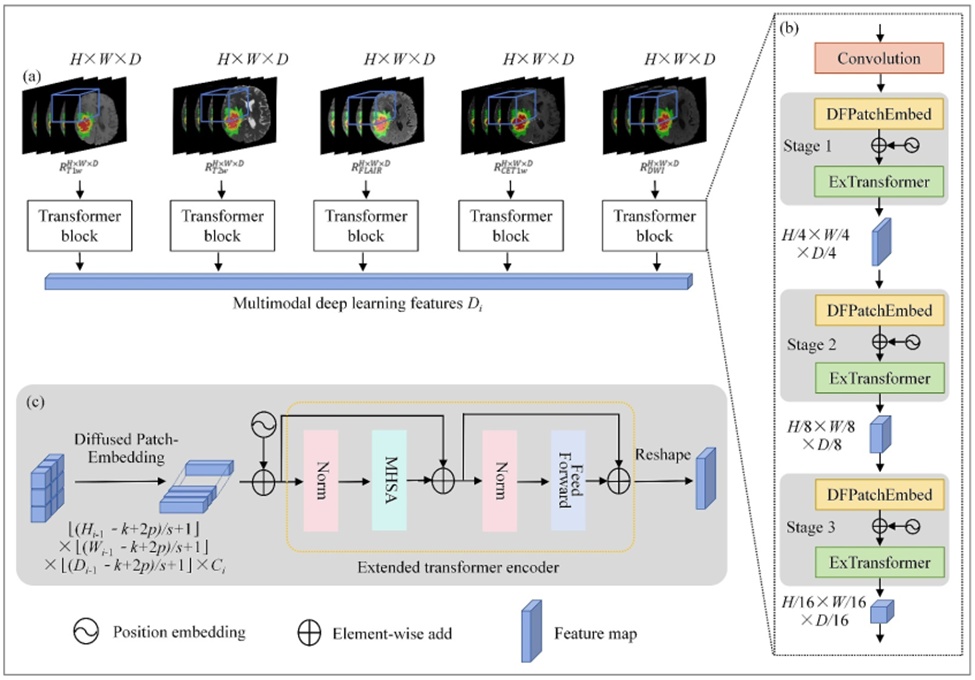
Figure 3. The overall architecture of the multi-modal transformer learning. (a) Multi-modal transformer structure for deep learning feature extraction from multi-modal MRI images; (b) internal mechanism of the transformer module incorporating DFPatchEmbed and ExTransformer; (c) data flow details of DFPatchEmbed and ExTransformer. DFPatchEmbed, diffused patch embedding; ExTransformer, extended transformer encoder; MHSA, multi-headed self-attention; Norm, normalisation.
To fully exploit both fine-grained and coarse-grained visual representations within the same feature level, DFPatchEmbed is introduced to operate on 3D-reshaped feature maps. DFPatchEmbed strengthens feature representation by incorporating local structural information across multiple granularities in the image. The preprocessed multi-modal MRI images are represented as three-dimensional matrices , , , , , corresponding respectively to T1w, T2w, FLAIR, CET1w, and DWI modalities.
Within DFPatchEmbed, for each modality , a learnable mapping transforms the feature matrix into a new token ( ) with channels. Here, g(·) denotes 3D convolution operations of size (k × k × k), producing a 3D token map, where . The dimensions , and represent the height, width, and depth of the feature map after convolution, defined as ⌊( - k + 2p)/s + 1⌋, ⌊( - k + 2p)/s + 1⌋, and ⌊( - k + 2p)/s + 1⌋, respectively. The token length can be flexibly controlled by adjusting the stride (s) and padding (p).
To construct vision tokens of varying spatial scales while maintaining consistent data length, multiple patch sizes (3 × 3, 5 × 5, 7 × 7) are employed to form parallel convolutional block embedding layers, as illustrated in Figure 4. The input image is partitioned into multiple patches, each of which is embedded independently. A corresponding vector representation is then derived, and the contribution of each patch to the target task is assessed through this representation. In parallel, stacked convolutions of identical kernel sizes are used to enlarge the receptive field while reducing parameter count. Specifically, two successive 3 × 3 convolutions are used to construct an effective 5 × 5 receptive field, and three 3 × 3 convolutions are used to construct a 7 × 7 receptive field.
The resulting feature (), (), () , all sharing the same size (H/s × H/s × D), are subsequently fed into the transformer encoder, where , , denote features extracted at different scales. DFPatchEmbed fuses information from multiple patch scales to support target localization and classification, capturing both local patch-level details and the spatial relationships and contextual dependencies among patches. This integrated structural and contextual representation improves the overall robustness of the model.
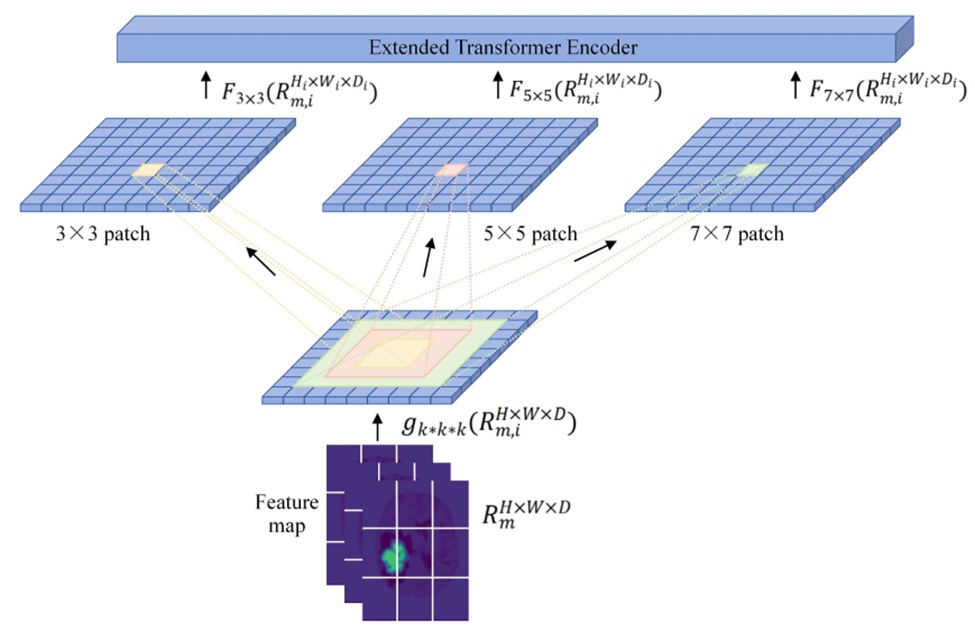
Figure 4.The detailed of diffused patch embedding.
During the encoding stage, the ExTransformer relies on dual residual structures utilizing skip connections. Each individual block comprises a pair of layer normalization (Norm) stages, a multi-head self-attention (MHSA) module, and a feed-forward neural layer (Figure 3c). The mechanical core of the transformer depends on query (Q), key (K), and value (V) vectors. The query vector anchors attention on a particular sequence position, matching it against all available key vectors across the sequence to map out where the model should concentrate focus. Every sequence coordinates a corresponding key vector, which computes a localized similarity coefficient when paired with the query vector. This calculated score denotes the alignment between query and key variables, pinpointing target regions for prioritization. The value vector encapsulates the actual informative data, which is integrated via a weighted summation guided by the computed attention scores. By matching the query vector Q across the key-value sequence pairs, a series of n similarity metrics are obtained. Passing these metrics through a Softmax activation produces the finalized attention weights that capture the relational dependency between queries and keys. The resulting score matrix is then multiplied by the value array to yield the final token representations:
 (1)
In this framework, Q, K, and V represent the query, key, and value vectors. A scaling parameter, , is introduced to optimize data variance during normalization, finalizing the expression for the MHSA block. This scaling ensures numerical stability during backpropagation, checking gradient degradation or escalation while stabilizing overall network convergence.
The primary encoder blocks guide the focus of the network toward high-priority regions within the image space. Next, the multi-modal feature interaction block unifies the isolated feature keys ∈ by executing a concatenation operation following Eq. 2, where Concat denotes tensor joining:
 (2)
Following the extraction of deep learning representations , these features are merged with the selected radiomic descriptors and clinical variables via concatenation. The radiomic feature set is denoted as ,, where F represents the total number of extracted features and MMM corresponds to the number of MRI modalities. Clinical variables are formulated as , where nnn denotes the number of clinical attributes considered. The resulting unified feature vector is then forwarded to the Aggregation layer (Figure 2d).
In this stage, a fully connected layer is adopted to further fuse the multimodal information. This layer performs a linear mapping of the concatenated representation using a learnable weight matrix and bias vector, followed by the application of a nonlinear activation function, which improves the representational capability of the network. The final IDH genotyping prediction is obtained as follows:
 (3)
Simultaneously, the blended data stream is evaluated through a parallel output layer to classify overall glioma survival risk, formulated as:
 (4)
The proposed learning framework is constructed within the PyTorch environment, utilizing hardware acceleration from an NVIDIA Quadro M4000 GPU to minimize training durations. To maximize model generalizability, a cross-validation training routine is utilized, allotting 80% of the registry for model optimization and reserving the remaining 20% for parameter tuning. Crucial hyperparameters, including learning rates, batch caps, dropout fractions, and epoch boundaries, are initialized based on historical literature benchmarks before being iteratively tuned by monitoring live validation metrics. The network relies on an exponential decay learning rate curve to facilitate rapid optimization loops early on while ensuring precise convergence near the global minimum in later phases. The batch volume is constrained to 4 for GPU memory optimization, with training capped at a maximum of 1000 epochs. To actively combat overfitting trends within the concatenation node, a dropout probability of 0.5 is implemented. Data augmentation routines are continuously applied, including random rotations spanning −10° and 10°, spatial cropping down to 128 × 128 × 112, multi-planar mirror flips, and random intensity scaling using a coefficient of 0.1. Class distribution bias is an inherent obstacle in medical imaging tasks; inside this glioma cohort, the population of IDH-wildtype tumors outnumbers IDH-mutant cases by roughly a 3:1 margin (Table 1). To resolve this distribution skew, a Focal Loss function is utilized for the IDH genotyping objective, which helps elevate classification accuracy by down-weighting the loss contributions of easily classified, high-confidence samples. The formulation is structured as follows:
 (5)
Table 1. Clinical characteristics of dataset.
All (n = 563) | LGG (n = 76) | HGG (n = 487) | |
Sex |
|
|
|
Male | 340 (60.39%) | 43 (56.58%) | 297 (60.99%) |
Female | 223 (39.61%) | 33 (43.42%) | 190 (39.01%) |
Age |
|
|
|
Mean ± SD (range) | 56.83 ± 15.01 (17–94) | 55.22 ± 13.85 (22–71) | 58.76 ± 14.01 (17–94) |
IDH status |
|
|
|
IDH-mutant | 144 (25.58%) | 56 (73.68%) | 88 (18.07%) |
IDH-wild | 419 (74.42%) | 20 (26.32%) | 399 (81.93%) |
Among these variables, (p) represents the confidence level of the sample, while γ denotes a parameter that is learned automatically by the model.
For glioma survival risk assessment, patients are categorized into low-risk (SD ≥ 480), medium-risk (240 < SD < 480), and high-risk (SD ≤ 240) groups according to survival duration (SD). Given that the sample distribution across these three subgroups is relatively balanced, the cross-entropy loss function is adopted for the survival risk classification task. By optimizing a joint loss function that integrates the objectives of both tasks, the model is able to effectively learn shared representations and capture the interdependencies between IDH genotyping and glioma prognosis.
To rigorously assess the utility of the formulated architecture, a series of comparative benchmark investigations were executed. The predictive yields for both IDH genetic profiling and glioma mortality risk stratification were evaluated alongside historical investigative milestones and sophisticated artificial intelligence networks. Conventional deep learning networks, including VGG [21], ResNet [22], DenseNet [23], and RetNet [24], are widely deployed across computer vision domains. Crucially, prior literature has not presented a multi-task learning configuration designed to simultaneously solve IDH mutation forecasting and glioma survival risk stratification.
The classification efficacy of the model across both diagnostic objectives was quantified using the area under the receiver operating characteristic curve (AUC), accuracy (Acc), sensitivity (Sens), and specificity (Spec). A five-fold cross-validation strategy was implemented, with all performance statistics reported as arithmetic means. Statistical variances between the proposed framework and competing architectures were validated using the DeLong test. For the multi-class survival risk assessment task, macro-averaged computations were applied to derive synthesized AUC, Sens, and Spec scores.
This study utilized cross-validation to enhance empirical objectivity, guaranteeing that every clinical subject underwent evaluation exactly once across the experimental timeline. Within the IDH mutation forecasting workflow, the definitive IDH mutation profile served as the ground-truth label for both the Mann–Whitney U test and the LASSO logistic regression pipeline. As an illustration, during the initial validation fold, radiomic computations isolated 26 distinct features from the collective T1w, T2w, FLAIR, CET1w, and DWI sequences that exhibited significant variations relative to IDH mutation profiles. These parameters, channeled into the network as quantitative inputs, comprised 1 first-order statistical metric (skewness), 1 texture metric (inverse variance derived from the grey-level co-occurrence matrix), and 24 higher-order statistical variables generated via wavelet transforms and Laplacian of Gaussian filtering (Figure 5). In Figure 5a, the LASSO path delineates the trajectory of the model's feature coefficients as a function of the regularization parameter \alpha. The horizontal axis maps the magnitude of this regularization factor, whereas the vertical axis monitors the scaling of individual feature coefficients. Each independent line within the plot maps the path of a specific feature coefficient. As the regularization constraints scale up, these coefficients systematically contract, causing less informative variables to drop to zero and thereby achieving optimized feature selection. Figure 5b presents the final subset of radiomic markers preserved by the LASSO screening along with their exact coefficient weights. These extracted radiomic markers, alongside the standardized image volumes and baseline clinical metrics, were subsequently introduced into the architecture for training. The final dimension of the generated deep learning feature vector was fixed at 128. Recognizing that transformer models display maximum efficacy when trained on extensive data registries, this framework was validated using five-fold cross-validation. As detailed in Table 2, the network yielded a mean AUC of 91.40% paired with a mean accuracy of 90.59% for the IDH genotyping objective. The precise classification accuracy reached 89.74% for IDH-wildtype tumors and 93.06% for IDH-mutant expressions. Across the isolated HGG and LGG sub-cohorts, the network registered F1 scores of 0.93 and 0.87, respectively, for IDH mutation tracking, demonstrating robust generalization across distinct tumor grades. Evaluated across the entire consolidated patient registry, the model achieved a comprehensive F1 score of 0.93. A comparative analysis against alternative IDH classification frameworks is outlined in Table 3. Methodological performance gaps were authenticated via the DeLong test, where a two-tailed p value < 0.05 denoted statistical significance.
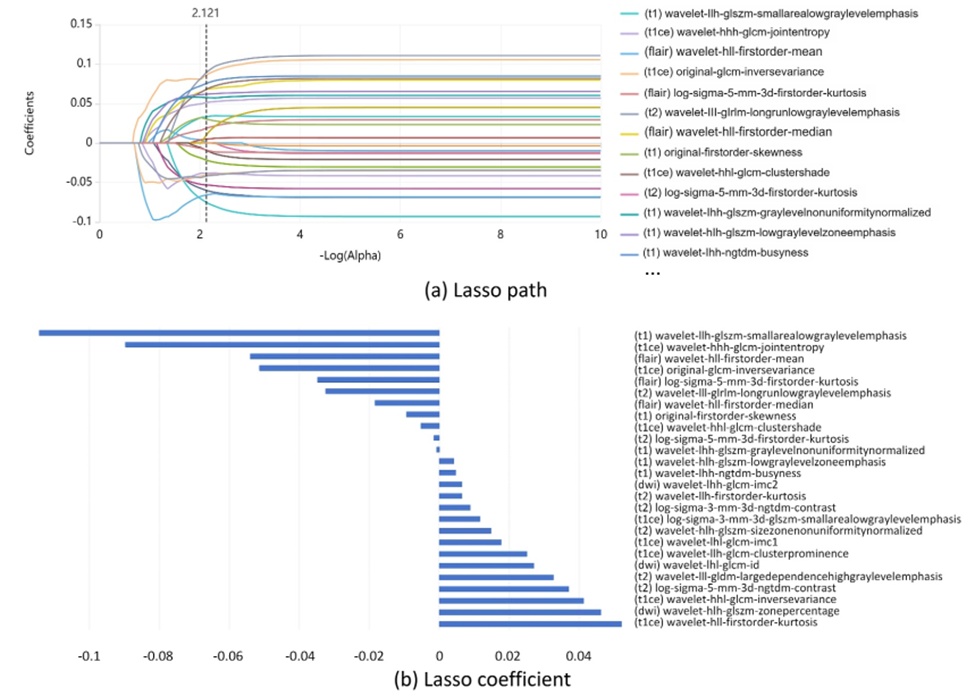
Figure 5. Radiomic features extraction in the IDH genotyping predicting task. (a) LASSO path: variation of feature coefficients with regularisation parameter; (b) radiomics features selection and coefficients via LASSO.
Table 2. IDH genotyping predicting results.
95% confidence interval | Standard error | p | F1 | Spec (%) | Sens (%) | Acc (%) | AUC (%) | |
HGG | 0.889 to 0.940 | 0.0154 | < 0.001 | 0.93 | 90.23 | 93.18 | 90.35 | 91.70 |
LGG | 0.839 to 0.972 | 0.0376 | < 0.0001 | 0.87 | 90.00 | 94.64 | 92.11 | 92.30 |
All data | 0.888 to 0.936 | 0.0130 | < 0.0001 | 0.93 | 89.74 | 93.06 | 90.59 | 91.40 |
Table 3. Comparison of the classification results of IDH mutation status by our method with other models.
Study / Approach | Dataset Source / Imaging Modality / Sample Size | DeLong Test | Specificity (%) | Sensitivity (%) | Accuracy (%) | AUC (%) |
Taha et al. [25] | TCIA, TCGA / Post-gadolinium T1-weighted images / 326 | — | — | — | 75.00 | — |
Choi et al. [26] | Severance Hospital, Seoul National University Hospital, TCIA / T1 post-contrast, T2, FLAIR / 1166 | — | — | — | 78.80 | 86.00 |
Gao et al. [27] | The First Affiliated Hospital of Zhengzhou University / DWI, DTI, DKI, NODDI, MAP / 215 | — | 16.00 | 98.72 | 78.64 | 79.00 |
Céline De Looze et al. [28] | Beaumont Hospital Medical Center / T1w, T2w, FLAIR, CET1w, DWI / 381 | — | 77.00 | 81.00 | — | 88.00 |
VGG [21] | TCIA, Henan Provincial People’s Hospital / T1w, T2w, FLAIR, CET1w, DWI / 563 | p < 0.0001 | 79.71 | 78.47 | 79.40 | 79.10 |
ResNet [22] | TCIA, Henan Provincial People’s Hospital / T1w, T2w, FLAIR, CET1w, DWI / 563 | p = 0.0006 | 86.16 | 81.25 | 84.90 | 83.70 |
DenseNet [23] | TCIA, Henan Provincial People’s Hospital / T1w, T2w, FLAIR, CET1w, DWI / 563 | p = 0.0108 | 84.73 | 87.50 | 85.44 | 86.10 |
RetNet [24] | TCIA, Henan Provincial People’s Hospital / T1w, T2w, FLAIR, CET1w, DWI / 563 | p = 0.6750 | 89.50 | 91.67 | 90.00 | 89.80 |
Proposed Method | TCIA, Henan Provincial People’s Hospital / T1w, T2w, FLAIR, CET1w, DWI / 563 | — | 89.74 | 93.06 | 90.59 | 91.40 |
Note: Bold values denote optimal empirical results (e.g., maximum accuracy, superior performance indicators).
Throughout each cross-validation phase, 113 unique patients with verified survival records were evaluated. Quantitative radiomic characterization served as the initial phase of the overall survival forecasting pipeline, capturing architectural, volumetric, and surface-area metrics. Within the survival risk classification workflow, clinical survival group designations served as labels for the Mann–Whitney U test and the LASSO logistic regression framework. For instance, in the first validation fold, 1 first-order statistical parameter (skewness), 1 texture parameter (derived from the grey-level size zone matrix), and 19 higher-order statistical features (computed via wavelet and Laplacian of Gaussian filters) tightly coupled with patient survival duration were isolated via radiomic profiling (Figure 6). Figure 6 illustrates both the LASSO optimization path and the resulting feature coefficients for the glioma prognostic pipeline. To model the exact survival duration of glioma patients in days, the framework was trained on a combination of extracted image parameters (comprising radiomic signatures and deep learning vectors) and non-image variables (encompassing biological sex, chronological age, histopathological grade, IDH mutation status, and molecular tumor subclass). The survival risk forecasting task was executed as a 3-class categorization problem, with the predictive outputs for the low-, medium-, and high-risk cohorts presented in Table 4. The proposed network achieved specific AUC scores of 94.4%, 93.2%, and 92.5% for the low-, medium-, and high-risk cohorts, respectively. Furthermore, comparative trials revealed that the model's classification accuracy across the five-fold cross-validation matrix outperformed competing state-of-the-art frameworks applied to this objective (Table 5). Table 5 presents a collective evaluation of all samples in the registry, where the reported AUC, sensitivity (Sens), and specificity (Spec) values reflect the unified performance across all three risk categories.
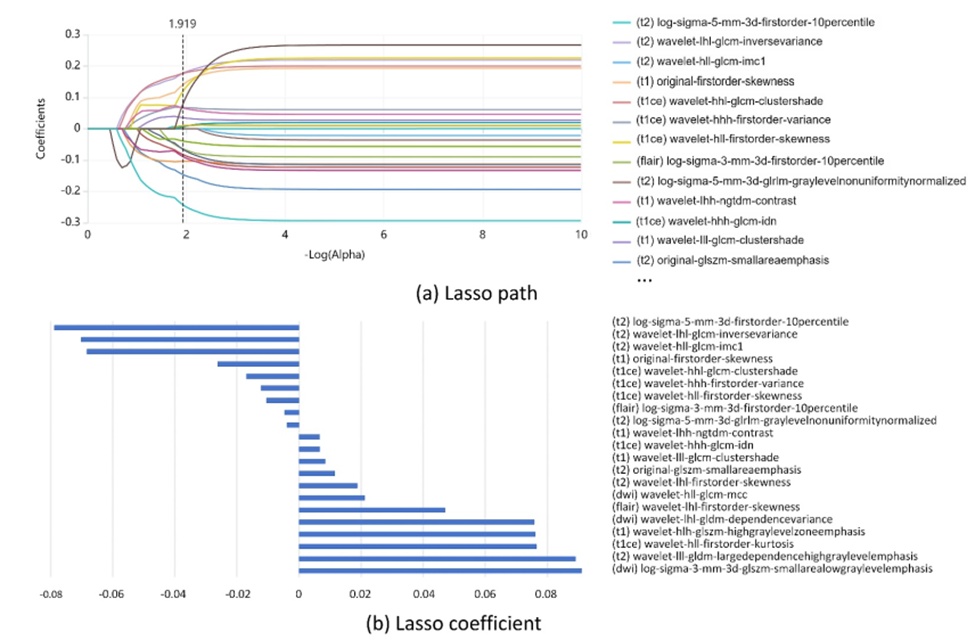
Figure 6. Radiomic features extraction in the glioma survival risk predicting task. (a) LASSO path: variation of feature coefficients with regularisation parameter; (b) radiomics features selection and coefficients via LASSO.
Table 4. Glioma survival risk predicting results.
95% confidence interval | Standard error | p | Spec (%) | Sens (%) | AUC (%) | Sample size | |
Low-risk group | 0.921 to 0.961 | 0.0124 | < 0.0001 | 90.81 | 91.67 | 94.40 | 228 |
Medium-risk group | 0.908 to 0.951 | 0.0134 | < 0.0001 | 82.87 | 87.02 | 93.20 | 131 |
High-risk group | 0.900 to 0.945 | 0.0105 | < 0.0001 | 85.97 | 84.65 | 92.50 | 204 |
Table 5. Comparison of the classification results of glioma survival risk assessment by our method with other models.
Data source/modality/numbers | DeLongtest | Spec(%) | Sens (%) | AUC(%) | |
Choi et al. [29] | Yonsei University College of Medicine, TCIA, TCGA/T2w, FLAIR, CET1w/296 | — | — | — | 70.90 |
Yoon et al. [30] | Samsung Medical Center/T1w, T2w, FLAIR, CET1w, DWI/118 | — | — | — | 79.00 |
Pasquini et al. [31] | Sant’ Andrea Hospital La Sapienza University of Rome, Regina Elena Institute of Rome/T1w, T2w, FLAIR, rCBV, DWI/156 | — | — | — | 74.50 |
VGG [23] | TCIA, Henan Provincial People’s Hospital/T1w, T2w, FLAIR, CET1w, DWI/563 | p < 0.0001 | 68.86 | 79.98 | 81.37 |
ResNet [32] | TCIA, Henan Provincial People’s Hospital/T1w, T2w, FLAIR, CET1w, DWI/563 | p < 0.0001 | 78.19 | 76.47 | 84.30 |
DenseNet [33] | TCIA, Henan Provincial People’s Hospital/T1w, T2w, FLAIR, CET1w, DWI/563 | p < 0.0001 | 81.34 | 77.75 | 85.70 |
RetNet [24] | TCIA, Henan Provincial People’s Hospital/T1w, T2w, FLAIR, CET1w, DWI/563 | p < 0.0001 | 86.49 | 85.72 | 89.20 |
Our method | TCIA, Henan Provincial People’s Hospital/T1w, T2w, FLAIR, CET1w, DWI/563 | — | 86.55 | 87.78 | 93.37 |
Note: Bold values denote optimal empirical results (e.g., maximum accuracy, superior performance indicators).
Ablation investigations were systematically conducted to evaluate the individual contributions of core structural components within our framework. Table 6 provides an itemized breakdown of performance fluctuations across alternative model configurations. The empirical outcomes of this ablation analysis show that the introduction of cross-modal interactions via DFPatchEmbed and ExTransformer modules substantially improved the network's predictive capabilities across both the IDH genotyping and glioma survival forecasting tasks.
Table 6. The performance of our model with different components for IDH genotyping and glioma prognosis tasks.
Components |
| Glioma prognosis task |
|
| IDH genotyping task |
| |
DFPatchEmbed | ExTransformer | Spec (%) | Sens (%) | AUC (%) | Spec (%) | Sens (%) | AUC (%) |
√ | 85.45 | 85.87 | 89.72 | 87.02 | 90.46 | 89.84 | |
√ | 86.03 | 86.91 | 91.25 | 88.37 | 91.95 | 90.07 | |
√ | √ | 86.55 | 87.78 | 93.37 | 89.74 | 93.06 | 91.40 |
Note: Bold values denote optimal empirical results (e.g., maximum accuracy, superior performance indicators).
To clarify the diagnostic relevance of individual imaging protocols, we examined the performance shifts of our framework under varying permutations of multi-modal MRI inputs. Structural sequences (comprising T1w, T2w, FLAIR, and CET1w) map out the anatomical architecture of the lesion, the extent of surrounding edema, localized vascular perfusion, and cerebrospinal fluid dynamics. Conversely, functional tracks (specifically DWI) map out microstructural tumor physiology by capturing the restricted diffusion and microscopic movement of water molecules. Initially, structural and functional sequences were channeled into the framework independently to establish baseline performance metrics. Subsequently, individual structural sequences (T1w, T2w, FLAIR, and CET1w) were sequentially coupled with DWI to execute targeted model training and validation. Following this, we conducted an analysis to isolate the specific drop in AUC caused by the complete omission of any single MRI sequence. Table 7 details the exact performance shifts of our network across different imaging input combinations for both tasks. Additionally, a Kappa consistency analysis was performed to gauge the predictive alignment between these distinct imaging paradigms. When structural and functional data channels were evaluated in isolation, the architecture registered a Kappa coefficient of 0.83 for the IDH genotyping task and a Kappa coefficient of 0.81 for the glioma prognosis task, demonstrating high diagnostic concordance between the distinct radiological modalities.
Table 7. The performance of our model with different imaging modalities for IDH genotyping and glioma prognosis tasks.
Imaging modalities |
|
|
|
| AUC |
|
T1w | T2w | FLAIR | CET1w | DWI | Glioma prognosis task | IDH genotyping task |
√ | √ | √ | √ | 86.08 | 85.37 | |
√ | 82.17 | 82.46 | ||||
√ | √ | 87.09 | 86.90 | |||
√ | √ | 87.53 | 86.43 | |||
√ | √ | 86.18 | 85.06 | |||
√ | √ | 88.74 | 87.57 | |||
√ | √ | √ | √ | 85.99 | 86.83 | |
√ | √ | √ | √ | 87.67 | 86.14 | |
√ | √ | √ | √ | 87.35 | 85.90 | |
√ | √ | √ | √ | 89.04 | 84.49 | |
√ | √ | √ | √ | √ | 93.37 | 91.40 |
Note: Bold values denote optimal empirical results (e.g., maximum accuracy, superior performance indicators).
Deep learning technologies have rapidly transformed oncological research, particularly regarding the noninvasive mapping of radiological features to molecular phenotypes or patient survival paths [11, 12, 26, 28-32]. This algorithmic approach is widely expected to complement or substitute for invasive surgical biopsies when identifying IDH mutations and stratifying survival risk in glioma cohorts. In this manuscript, we introduced a unified multi-task deep learning architecture that leverages multi-modal MRI data to concurrently forecast molecular IDH mutations and map longitudinal survival risks.
The formulated multi-task optimization network demonstrates that fusing radiomic features, deep learning vectors, and clinical records significantly yields superior IDH genotyping and glioma survival predictions. Historically, an AUC within the range [0.50, 0.70] represents marginal classification accuracy, a range of [0.71, 0.90] indicates moderate efficacy, and scores exceeding 0.90 signify superior clinical precision [34]. As documented in Table 2, our architecture achieved specific AUC scores of 91.7% and 92.3% for IDH mutation tracking within isolated HGG and LGG patient cohorts, respectively. These metrics underscore the network's capacity to maintain high performance across varying histopathological tumor classifications, highlighting its potential for clinical translation. Furthermore, across the entire unstratified patient cohort, the framework demonstrated an overall AUC of 91.40%, an accuracy of 90.59%, a sensitivity of 93.06%, and a specificity of 89.74% (Table 3).
Prior literature has indicated that the radiological manifestations of gliomas on MRI may be linked to the underlying molecular profile of the IDH gene. For instance, within low-grade glioma (LGG) cohorts, lesions harboring IDH mutations are more frequently situated in the frontal lobe and peripheral, non-midline regions [35, 36]. Compared to their IDH-wildtype counterparts, these specific lesions are characterized by well-defined borders, homogenous internal signal intensity, and a lower degree of contrast enhancement [37]. Furthermore, IDH-mutant malignancies frequently present with limited peritumoral edema and a elevated incidence of intratumoral calcification [38]. Even so, conventional MRI features generally lack the specificity required to definitively predict the histopathological or molecular classifications of gliomas in individual clinical cases [39]. Implementing artificial intelligence paradigms in radiological workflows can expose latent data hidden within MRI tracks, thereby assisting in the determination of IDH genotypes. Distinct MRI sequences supply complementary variables for differentiating IDH mutation status. Specifically, T1w images yield structural detail regarding glioma morphology; T2w sequences exhibit high sensitivity to fluid accumulation, offering insight into tumor margins and the scope of surrounding edema; whereas CET1w profiles mirror the microvascular blood flow characteristics of the lesion [40]. FLAIR sequences suppress the signal from free water molecules, thereby accentuating abnormal hyperintensities adjacent to the cerebral cortex and facilitating the differentiation of vasogenic edema from cerebrospinal fluid [41, 42]. Concurrently, DWI maps the microscopic diffusion and displacement of water molecules within the tumor architecture, serving to gauge histological malignancy and therapeutic response [27, 43]. Choi et al. introduced a hybrid architecture combining convolutional neural networks (CNNs) with radiomic workflows utilizing contrast-enhanced T1, T2, and FLAIR data, which achieved an AUC of 86% alongside an accuracy of 78.8% for IDH categorization [26]. Another investigation detailed in Radiology leveraged whole-tumor histograms to evaluate diffusion-tensor imaging (DTI), diffusion-kurtosis imaging (DKI), neurite orientation dispersion and density imaging (NODDI), and mean apparent propagator (MAP) metrics, establishing AUC scores of 0.76, 0.82, 0.78, 0.81, and 0.82, respectively, within a cohort of 215 subjects [27]. Sophisticated imaging strategies, such as MR spectroscopy for the detection of the 2-hydroxyglutarate oncometabolite and 18F‒fluoro-ethyl-tyrosine (FET)-PET, have similarly been documented as effective tools for identifying specific molecular glioma subgroups [44, 45]. Nevertheless, these advanced metabolic imaging techniques are not widely accessible in routine clinical workflows. The primary advantage of our introduced framework relies on its utilization of T1w, T2w, FLAIR, CET1w, and DWI paths, which constitute standard MRI sequences routinely acquired in standard hospital protocols. The rapid evolution of radiomics and deep learning algorithms opens the door to merging these quantitative metrics with deeper latent features to further refine the classification of IDH molecular variants.
To systematically evaluate classification precision, the introduced model was benchmarked against historical investigative achievements and sophisticated artificial intelligence methodologies. VGG, ResNet, and DenseNet represent deep convolutional neural networks (CNNs) designed to extract image patterns by stacking sequential convolutional layers. These architectures share core structural properties, such as the use of basic convolutional and pooling operators, and maximize performance by iteratively optimizing network layer weights. They additionally mitigate the challenges of vanishing and exploding gradients to a certain degree, enabling the engineering of deeper network profiles. Nonetheless, critical structural variations distinguish these networks. VGG increases classification capacity primarily by scaling the number of network layers, emphasizing the role of vertical network depth. ResNet incorporates residual skip connections, which simplify the optimization optimization loops of highly deep architectures. DenseNet utilizes a densely connected pattern where the outputs of every preceding layer are linked directly to all subsequent layers, a design that enhances information flow and feature recycling throughout deeper network blocks. ResNet, VGG, and DenseNet each exist in multiple variations. In our comparative trials, we deployed ResNet50, VGG19, and DenseNet201. The selection of these specific network configurations was guided by the spatial dimensions of the input imagery, aiming to isolate deep latent features while avoiding the pitfalls of overfitting. RetNet resolves the high computational overhead and low operational efficiency typical of conventional transformer structures by introducing a multi-scale retention operator that accommodates both parallel and recurrent data representations, thereby ensuring highly efficient inference alongside amplified feature representations. Consequently, RetNet was integrated into this investigation to provide a comparative baseline for our developed framework.
The framework introduced in this study diverges from standard AI models such as VGG, ResNet, DenseNet, and RetNet because it is purposefully tailored to the unique physical properties of MRI volumes, rendering it more aligned with clinical objectives and highly effective in both IDH genotyping and glioma survival stratification tasks. Our IDH genotyping metrics outperform the majority of prior literature benchmarks (Table 3), an improvement likely driven by the simultaneous incorporation of structural and functional MRI tracks alongside baseline clinical data. This holistic strategy integrates a richer patient data profile for the assessment of IDH alterations, yielding superior classification accuracy relative to models restricted to one or two imaging tracks. When specific imaging sequences are omitted, a corresponding decrease is observed in the AUC metrics for IDH variant classification, demonstrating that each individual MRI modality and sequence offers a distinct and valuable contribution to the understanding of the pathology (Table 7). Multi-modal feature vectors offer a more comprehensive representation of the lesion, boosting the model's capacity to categorize IDH variants and forecast patient longevity. Given that the baseline probability of a genetic mutation in glioma is strongly linked to histopathological tumor grade, a targeted subgroup evaluation was executed. The findings indicate that the network's capacity to predict IDH mutations remains highly consistent across both the LGG and HGG cohorts. Conversely, Zhao et al. observed that IDH mutation prediction within the HGG cohort outperformed results in the LGG cohort, with specificity values slightly exceeding sensitivity metrics [46]. A separate study noted that sensitivity lagged behind specificity when predicting IDH profiles in LGG cohorts [47]. Our framework demonstrated equivalent precision when predicting IDH profiles in both the HGG and LGG strata, with sensitivity metrics consistently outperforming specificity values, which underscores a heightened sensitivity toward identifying IDH-mutant instances. The outcomes of these stratified analyses confirm that the model preserves robust performance even when subjected to class distribution imbalances. This superior sensitivity for IDH-mutant cases confirms the network's capability to isolate key radiological markers. As shown in Table 3, certain prior investigations document higher sensitivity profiles in IDH classification, whereas others exhibit superior specificity, a variance that can likely be attributed to differences in dataset compositions and individual patient heterogeneity within glioma cohorts.
The multi-modal MRI signatures of intracranial malignancies can simultaneously differentiate IDH variants and yield vital prognostic insights early in the diagnostic pathway. For example, Yan et al. demonstrated that by leveraging T1w, T2w, T2-FLAIR, CET1w, and ADC sequences, overall survival could be predicted with greater accuracy in LGG cohorts than in HGG cohorts [32]. Mapping the relationships connecting genetic alterations to specific imaging phenotypes offers a noninvasive avenue to extract prognostic information, thereby guiding clinical intervention paths. Our unified network has established strong results in glioma survival forecasting trials by integrating radiomic, deep learning, clinical, and genomic IDH variables. This success is directly attributable to the extraction of comprehensive deep features across multiple views and imaging sequences, rather than a reliance on single-modality variables. Parallel to modern genomic research that identifies relevant biomarkers within high-throughput sequencing repositories, engineering a multi-parametric radiomics and deep learning signature for mortality risk stratification represents an established and recognized artificial intelligence strategy.
Within the domain of glioma prognostic research, establishing a logical framework for patient cohort stratification is vital to ensure the validity and clinical relevance of the investigation. Prior literature has deployed diverse methodologies to achieve prognostic grouping. One common technique involves splitting the patient collective into binary cohorts based on an optimized risk score cutoff derived from the model, designed to maximize the statistical significance of overall survival differences between the groups [29]. A separate methodology treats overall survival as a continuous dependent variable to be predicted directly [30]. A third framework introduces a binary classification threshold based on a fixed 12-month survival baseline [31]. Furthermore, certain studies partition glioblastoma cohorts into three distinct categories based on survival duration: under 6 months (short-term survival), 6–18 months (intermediate survival), and exceeding 18 months (long-term survival) [33]. In short, a universally accepted benchmark for prognostic outcome stratification has not been established. In the current investigation, patient cases were divided into low-, medium-, and high-risk strata based on documented survival days. The statistical significance of the survival variations among these three cohorts was evaluated via the log-rank test, demonstrating a highly significant divergence between the groups (p < 0.05). Table 4 outlines the definitive classification results for the low-, medium-, and high-risk cohorts as determined by the developed deep learning architecture. The holistic AUC for survival risk forecasting surpassed 92.5%. This high diagnostic capability in survival risk assessment is achieved because our model merges low-level morphological, intensity, and textural features with higher-order abstract imaging patterns, thereby capturing a broader spectrum of intratumoral heterogeneity. Additionally, the empirical data show that the low-risk cohort is more readily identifiable by the system, whereas the medium-risk and high-risk cohorts present a greater predictive challenge. This variance is likely explained by the fact that patient longevity is dictated by a complex web of confounding clinical factors, including the spatial extent of tumor necrosis, individual physiological differences, and the presence of concurrent secondary pathologies [48].
Prognostic models based on integrated multi-modal datasets have demonstrated superior accuracy compared to historical glioma survival models (Table 5). Traditionally, clinical metrics such as chronological age, biological sex, surgical resection margins, and conventional structural MRI sequences have been leveraged to model overall survival. Incorporating functional MRI parameters and molecular profiles yields a significant expansion in survival forecasting power compared to configurations restricted to clinical or structural imaging variables alone. For instance, T1w, T2-FLAIR, CET1w, DWI, and ADC profiles exhibit strong statistical correlations with patient survival metrics [30]. While the majority of prior investigations have depended primarily on open-source online repositories, this study establishes high diagnostic accuracy for glioma prognosis by fusing public registries with real-world clinical datasets. Furthermore, the integration of cross-validation techniques enhances the reproducibility of these empirical findings. Assessing the network's operational yield across individual imaging modalities for both analytical tasks (Table 7) confirms that structural and functional MRI tracks supply distinct, complementary dimensions of clinical information for the evaluation of glioma pathologies.
Given the well-documented clinical relationship connecting IDH genotyping with glioma survival trajectories, a multi-task learning architecture was implemented in this study to isolate shared data patterns and improve multi-objective prediction accuracy. We extracted radiomic features, deep learning vectors, and clinical profiles to build a comprehensive data matrix from the multi-modal inputs. These integrated features were subsequently funneled into our multi-task framework, which optimizes both target tasks simultaneously. The benefits of this multi-task training paradigm are clear: by concurrently optimizing for two highly correlated clinical objectives, the network is driven to map out shared latent representations that capture underlying pathological patterns common to both tasks. This significantly improves the model's capacity to generalize effectively to completely unseen patient data. Furthermore, the unified feature extraction architecture inherent to multi-task learning models incentivizes the network to learn more discriminative, highly informative features, thereby boosting overall performance across both endpoints. Finally, training on multiple concurrent objectives functions as an implicit mechanism of regularization, reducing the vulnerability of the network to overfitting on an isolated target task and ultimately producing more robust, reliable clinical predictions.
Model interpretability bolsters the openness and reliability of artificial intelligence frameworks by clarifying the underlying logic behind their diagnostic outputs. This transparency facilitates the validation and troubleshooting of algorithmic behavior, thereby refining overall precision and robustness. To investigate the functional dynamics of the transformer network, Gradient Class Activation Mapping++ [49] was deployed to visually map the diagnostic features isolated during the IDH genotyping and glioma survival risk stratification workflows. Our evaluation incorporates an interpretable analysis via spatial visualization techniques to decode the internal operational patterns of the network. During the validation phase, we tracked the specific anatomical areas prioritized by the model across the MRI volumes. The resulting attention heatmaps were compiled and reviewed by two independent clinicians holding intermediate or senior academic ranks, who evaluated and classified the network's focal zones. First, the diagnostic alignment between the two clinicians was authenticated via a Kappa consistency test, yielding Kappa values of 0.767 and 0.834 for the IDH stratification and prognostic tasks, respectively, which confirms strong inter-observer agreement. Subsequently, a chi-square test was executed for statistical significance testing, revealing p\text{-values} < 0.05 across both endpoints. This indicates a statistically significant divergence in the spatial regions prioritized by the network depending on the objective. Figure 7 illustrates these visual attention heatmaps for two clinical subjects from the TCIA registry across different imaging tracks. The multi-modal transformer system refines its classification capabilities by anchoring its focus on image regions containing relevant pathological lesions. In contrast to its behavior during the glioma survival risk assessment task, the architecture places greater emphasis on the spatial variations among the global tumor boundaries, the contrast-enhancing tumor zones, and the necrotic tumor core during the IDH genotyping task.
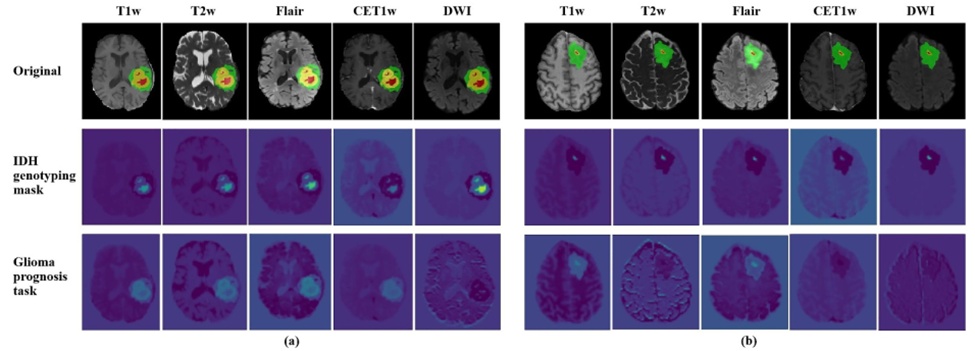
Figure 7. The visualisation results of the method based on multi-modal transformer. (a) UCSF-PDGM-026, Female, IDH-wildtype, high-risk group; (b) UCSF-PDGM-243, male, IDH-mutant, low-risk group.
In practical clinical scenarios, complete imaging protocols involving T1w, T2w, FLAIR, CET1w, and DWI sequences are not universally acquired for every patient. For example, individuals presenting with documented allergies to gadolinium-based contrast media or those suffering from acute hepatic or renal dysfunction cannot undergo contrast-enhanced imaging. To accommodate these real-world constraints, our network is designed with an adaptable framework, enabling it to operate successfully without requiring all five imaging tracks. The architecture can process restricted subsets of sequences, such as a combination of T1w, T2w, FLAIR, and DWI. This operational versatility is achieved by configuring the initialization stage of the framework with four parallel transformer blocks and dynamically shifting the internal tensor tracking operations while preserving the core structural network. Furthermore, parallel research efforts are investigating the synthetic generation of missing contrast-enhanced tracks via Generative Adversarial Networks (GANs), representing a compelling path for future methodology.
To provide a more comprehensive characterization of our methodology, the total parameter footprint and computational overhead of all evaluated deep learning frameworks across both the IDH genotyping and glioma survival tasks are itemized in Table 8. To maintain strict experimental standardization and ensure an equitable evaluation, all models were trained using identical hyperparameter constraints (e.g., a batch size of 4 paired with an input volume of [128, 128, 112]). The compiled metrics demonstrate that our introduced architecture represents a moderate-scale framework, requiring 41.39M parameters alongside 52.43G FLOPs. Based on the data documented in Table 8, it is evident that although our approach exhibits a larger computational overhead relative to ResNet architectures due to the integration of multi-head self-attention mechanisms, it yields superior computational efficiency relative to achieved AUC when benchmarked against alternative networks like VGG, DenseNet, and RetNet, while simultaneously delivering superior diagnostic accuracy. Subsequent engineering efforts will focus on driving down computational overhead and optimizing overall execution efficiency.
Table 8. The parameter size and computational complexity of different models.
Model | Param | FLOPs | AUC of glioma prognosis task | AUC of IDH genotyping task |
VGG [23] | 83.01M | 98.62G | 81.37 | 79.10 |
ResNet [32] | 43.63M | 49.65G | 84.30 | 83.70 |
DenseNet [33] | 38.94M | 61.57G | 85.70 | 86.10 |
RetNet [24] | 47.07M | 74.59G | 89.20 | 89.80 |
Our method | 41.39M | 52.43G | 93.37 | 91.40 |
Abbreviation: FLOPs, floating-point operations per second.
Our investigation presents several limitations that warrant consideration. First, compiling a larger, more comprehensive registry that includes verified long-term prognostic trajectories is crucial to further refine predictive precision and clinical utility. Forging collaborative networks with external medical institutions and collaborative research consortia will facilitate the construction of a more representative dataset, thereby boosting the network's capacity to model IDH genotyping and survival hazards in glioma. Additionally, integrating granular clinical records—such as the exact extent of surgical resection and specific therapeutic regimens—could fortify the classification performance of the model. Second, analyzing the spatial mapping of deep learning variables indicates that investigating the subtle discrepancies in the regions of interest between the IDH mutation forecasting and prognostic risk tracking tasks represents a highly promising research vector. Habitat analysis serves as an advantageous methodology to further examine and decode tumor microenvironments. Isolating specific sub-regions of tumor tissue characterized by uniform microenvironments will provide deeper insights into intratumoral heterogeneity. Finally, the scope of this investigation was restricted to the prediction of IDH mutations. Next-generation iterations of this research will focus on evaluating an expanded panel of molecular biomarkers, including 1p/19q co-deletions, MGMT promoter methylation status, and ATRX expression alterations. Maintaining close cross-disciplinary cooperation with practicing clinicians will ensure that our deep learning models can be effectively translated into real-world clinical environments, delivering valuable prognostic direction for patient care.
To address the persistent clinical hurdles surrounding molecular stratification and prognostic forecasting in neuro-oncology, this manuscript introduces a unified multi-task deep learning architecture based on multi-modal MRI data. This network comprehensively synthesizes patient radiological metrics and clinical histories, laying the groundwork for scalable and wide-ranging clinical integration. The architecture uniquely merges radiomic vectors, deep learning feature spaces, and baseline clinical parameters, leveraging a multi-modal transformer to capture highly informative features for concurrent genotype identification and survival hazard modeling, which ultimately improves overall classification accuracy. Empirical evaluations show that the network achieves comparable accuracy when predicting IDH profiles across both HGG and LGG cohorts, with IDH-mutant tumors being identified with greater ease than wildtype profiles. Within the glioma prognostic workflow, low-risk patient cohorts are isolated with higher accuracy than medium- or high-risk cases. Comparative benchmarking demonstrates that this integrated approach significantly improves the accuracy of IDH genotyping and glioma survival forecasting, demonstrating performance increments of 1.6%–12.4% and 4.17%–22.47%, respectively, over existing state-of-the-art frameworks.
In summary, these findings underscore the profound diagnostic utility of marrying comprehensive, multi-modal MRI feature representations with deep learning networks for automated IDH genotyping and survival risk stratification in glioma, successfully mitigating the challenges of pronounced radiologic heterogeneity. Despite the inevitable dataset variability inherent to multi-centre clinical registries, combining deep learning techniques and radiomic workflows with clinical records within a multi-modal MRI framework demonstrates a clear capacity to navigate this data divergence. This offers an encouraging, noninvasive paradigm for the molecular subtyping and prognostic mapping of gliomas. Ultimately, this noninvasive diagnostic biomarker can support more precise patient counseling and enrich the clinical decision-making process for a substantial segment of the glioma patient population.
We acknowledge the research design and data collection support received from National Natural Science Foundation of China. We acknowledge the data processing and modelling support received from Medical Science and Technology Research Project of Henan Province. We acknowledge the data analysis and interpretation support received from Joint Fund of Henan Province Science and Technology R&D Program and Henan Provincial Medical Science and Technology Research Joint Construction Project.
None
None
Multi-centre datasets were utilised in this study. The first dataset is an NIH/NCI-approved retrospective review of The Cancer Imaging Archive (TCIA) glioma databases. Data collection was performed in accordance with relevant guidelines and regulations and was approved by the University of California San Francisco institutional review board with a waiver for consent. The second dataset is from the PACS system of Henan Provincial People’s Hospital. All cases comply with the Helsinki Declaration and have been approved by the Ethics Committee of Henan Provincial People’s Hospital (approval number: 2021148).
Open Access The author(s) retain copyright. This article is licensed under the Creative Commons Attribution-NonCommercial-ShareAlike 4.0 International License. It may be shared and adapted for non-commercial purposes with appropriate attribution, an indication of changes, and distribution of adaptations under the same license. Third-party material may be subject to separate terms identified in its credit line. View the license at https://creativecommons.org/licenses/by-nc-sa/4.0/.
 Transparent Intelligence Publishing